With the release of Suricata 2.0.1 there is availability and option to do extended custom HTTP header fields logging through the JSON output module.
For the Elasticsearch/Logstash/Kibana users there is a ready to use template that you could download from here -
https://github.com/pevma/Suricata-Logstash-Templates
So what does this mean?
Well besides the standard http logging in the eve.json you also get 47 additional HTTP fields logged, mainly these:accept
accept-charset
accept-encoding
accept-language
accept-datetime
authorization
cache-control
cookie
from
max-forwards
origin
pragma
proxy-authorization
range
te
via
x-requested-with
dnt
x-forwarded-proto
accept-range
age
allow
connection
content-encoding
content-language
content-length
content-location
content-md5
content-range
content-type
date
etags
last-modified
link
location
proxy-authenticate
referrer
refresh
retry-after
server
set-cookie
trailer
transfer-encoding
upgrade
vary
warning
www-authenticate
What they are and what they mean/affect you could read more about here:
http://en.wikipedia.org/wiki/List_of_HTTP_header_fields
You can choose any combination of those fields above or all of them. What you need to do is simply add those to the existing logging in suricata.yaml's eve section. To add all of them if found in the HTTP traffic you could do like so:
- eve-log:Then you just start Suricata.
enabled: yes
type: file #file|syslog|unix_dgram|unix_stream
filename: eve.json
# the following are valid when type: syslog above
#identity: "suricata"
#facility: local5
#level: Info ## possible levels: Emergency, Alert, Critical,
## Error, Warning, Notice, Info, Debug
types:
- alert
- http:
extended: yes # enable this for extended logging information
# custom allows additional http fields to be included in eve-log
# the example below adds three additional fields when uncommented
#custom: [Accept-Encoding, Accept-Language, Authorization]
custom: [accept, accept-charset, accept-encoding, accept-language,
accept-datetime, authorization, cache-control, cookie, from,
max-forwards, origin, pragma, proxy-authorization, range, te, via,
x-requested-with, dnt, x-forwarded-proto, accept-range, age,
allow, connection, content-encoding, content-language,
content-length, content-location, content-md5, content-range,
content-type, date, etags, last-modified, link, location,
proxy-authenticate, referrer, refresh, retry-after, server,
set-cookie, trailer, transfer-encoding, upgrade, vary, warning,
www-authenticate]
- dns
- tls:
extended: yes # enable this for extended logging information
- files:
force-magic: yes # force logging magic on all logged files
force-md5: yes # force logging of md5 checksums
#- drop
- ssh
What is the benefit?
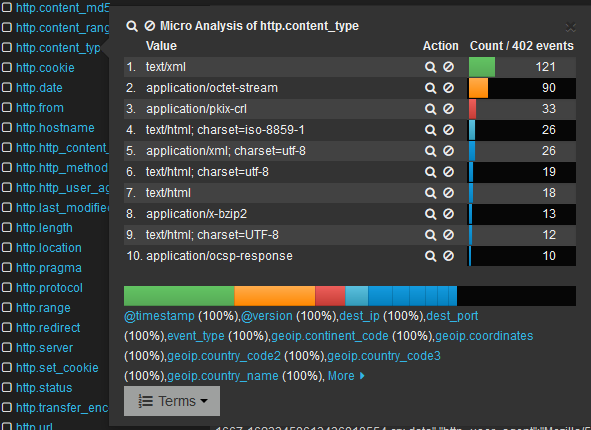
You can log and search/filter/select through any or all of those 60 or so http header fields. JSON is a standard format - so depending on what you are using for DB and/or search engine, you could get very easy interesting and very helpful statistics that would help your security teams.Some possible stats using Elasticsearch and Kibana
(how to set up Elasticsearch, Logstash and Kibana with Suricata)-


No comments:
Post a Comment