Sunday, August 24, 2014

Suricata - more data for your alerts


As of Suricata 2.1beta1  - Suricata IDS/IPS provides the availability of packet data and information in a standard JSON output logging capability supplementing further the alert logging output.

This guide makes use of Suricata and ELK - Elasticsearch, Logstash, Kibana.
You can install all of them following the guide HERE
 ...or you can download and try out SELKS  and use directly.


After everything is in place, we need to open the suricata.yaml and make the following editions in the eve.json section:

 # "United" event log in JSON format
  - eve-log:
      enabled: yes
      type: file #file|syslog|unix_dgram|unix_stream
      filename: eve.json
      # the following are valid when type: syslog above
      #identity: "suricata"
      #facility: local5
      #level: Info ## possible levels: Emergency, Alert, Critical,
                   ## Error, Warning, Notice, Info, Debug
      types:
        - alert:

            payload: yes           # enable dumping payload in Base64
            payload-printable: yes # enable dumping payload in printable (lossy) format
            packet: yes            # enable dumping of packet (without stream segments)
            http: yes              # enable dumping of http fields
       
You can start Suricata and let it inspect traffic for some time in order to generate alert log data.
Then navigate to your Kibana web interface, find an alert record/log and you could see the usefulness of the extra data yourself.

Some examples though :) :


Lets kick it up  notch.....

We want to search through -
  1. all the generated alerts that have 
  2. a printable payload data 
  3. that have the following string: uid=0(root)
 Easy, here is the query:
 
payload_printable:"uid=0\(root\)"
You should enter it like this in Kibana:


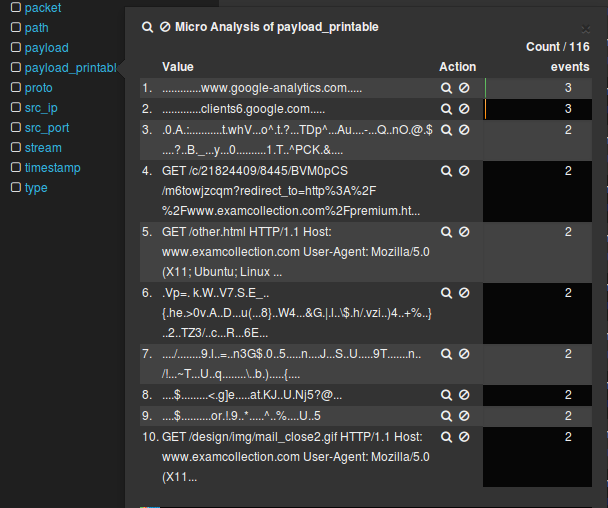
Well what do you know - we got what we were looking for:


Some more useful reading on the Lucene Query Syntax (you should at least have a look :) ):
http://www.elasticsearch.org/guide/en/elasticsearch/reference/current/query-dsl-query-string-query.html

http://www.solrtutorial.com/solr-query-syntax.html

http://lucene.apache.org/core/2_9_4/queryparsersyntax.html


Suricata - Flows, Flow Managers and effect on performance


As of Suricata 2.1beta1  - Suricata IDS/IPS provides the availability of high performance/advanced tuning for custom thread configuration for the IDS/IPS engine management threads.

Aka ..these
[27521] 20/7/2014 -- 01:46:19 - (tm-threads.c:2206) <Notice>  (TmThreadWaitOnThreadInit) -- all 16 packet processing threads, 3 management threads initialized, engine started.


These 3 management threads initialized above are flow manager (1), counter/stats related threads (2x)

So ... in the default suricata.yaml setting we have:

flow:
  memcap: 64mb
  hash-size: 65536
  prealloc: 10000
  emergency-recovery: 30
  #managers: 1 # default to one flow manager
  #recyclers: 1 # default to one flow recycler thread

and we can choose accordingly of how many threads we would like to dedicate for the management tasks within the engine itself.
The recyclers threads offload part of the flow managers work and if enabled do flow/netflow logging.

Good !
What does this has to do with performance?

Suricata IDS/IPS is powerful, flexible and scalable - so be careful what you wish for.
The examples below demonstrate the effect on a 10Gbps Suricata IDS sensor.

Example 1


suricata.yaml config - >
flow:
  memcap: 1gb
  hash-size: 1048576
  prealloc: 1048576
  emergency-recovery: 30
  prune-flows: 50000
  managers: 2 # default is 1

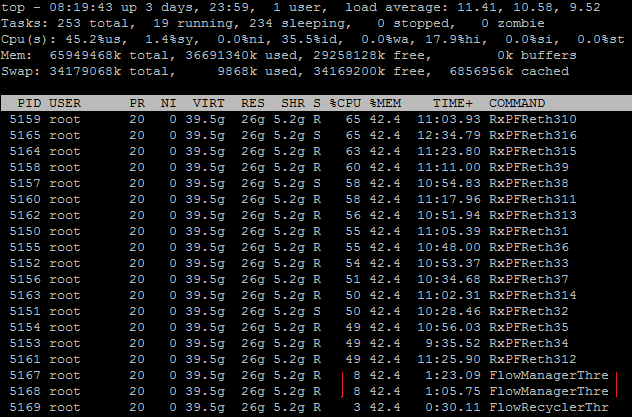
CPU usage ->

 2 flow management threads use 8% CPU each

 Example 2


suricata.yaml config - >
flow:
  memcap: 4gb
  hash-size: 15728640
  prealloc: 8000000
  emergency-recovery: 30
  managers: 2 # default is 1

 CPU usage ->

2 flow management threads use 39% CPU each as compared to Example 1 !!


So a 4 fold increase in memcap, 8 fold increase in prealloc and 15 fold increase on hash-size settings leads to about 3 fold increase in RAM consumption and 5 fold on CPU consumption  - in terms of flow management thread usage.

It would be very rare that you would need the settings in Example 2 - you need huge traffic for that...

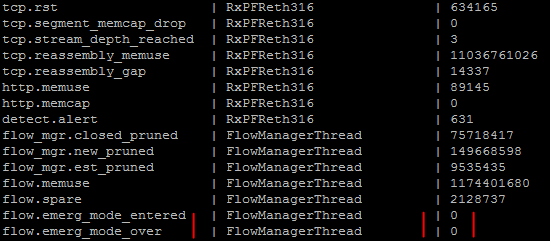
So how would you know when to tune/adjust those settings in suricata.yaml? It is recommended that you always keep an eye on your stats.log and make sure you do not enter emergency clean up mode:


it should always be 0

Some additional reading on flows and flow managers -
http://blog.inliniac.net/2014/07/28/suricata-flow-logging/


Suricata - filtering tricks for the fileinfo output with eve.json


As of Suricata 2.0  - Suricata IDS/IPS provides the availability of a standard JSON output logging capability. This guide makes use of Suricata and ELK - Elasticsearch, Logstash, Kibana.

You can install all of them following the guide HERE
 ...or you can download and try out SELKS  and use directly.

Once you have the installation in place and have the Kibana web interface up and running you can make use of the following fileinfo filters (tricks :).
You can enter the queries like so:


 fileinfo.magic:"PE32" -fileinfo.filename:*exe
will show you all "PE32 executable" executables that were seen transferred that have no exe extension in their file name:


 Alternatively
fileinfo.magic:"pdf" -fileinfo.filename:*pdf


will show you all "PDF document version......" files that were transferred that have no PDF extension in their file name.

You can explore further :)


Saturday, August 23, 2014

Suricata IDS/IPS - HTTP custom header logging


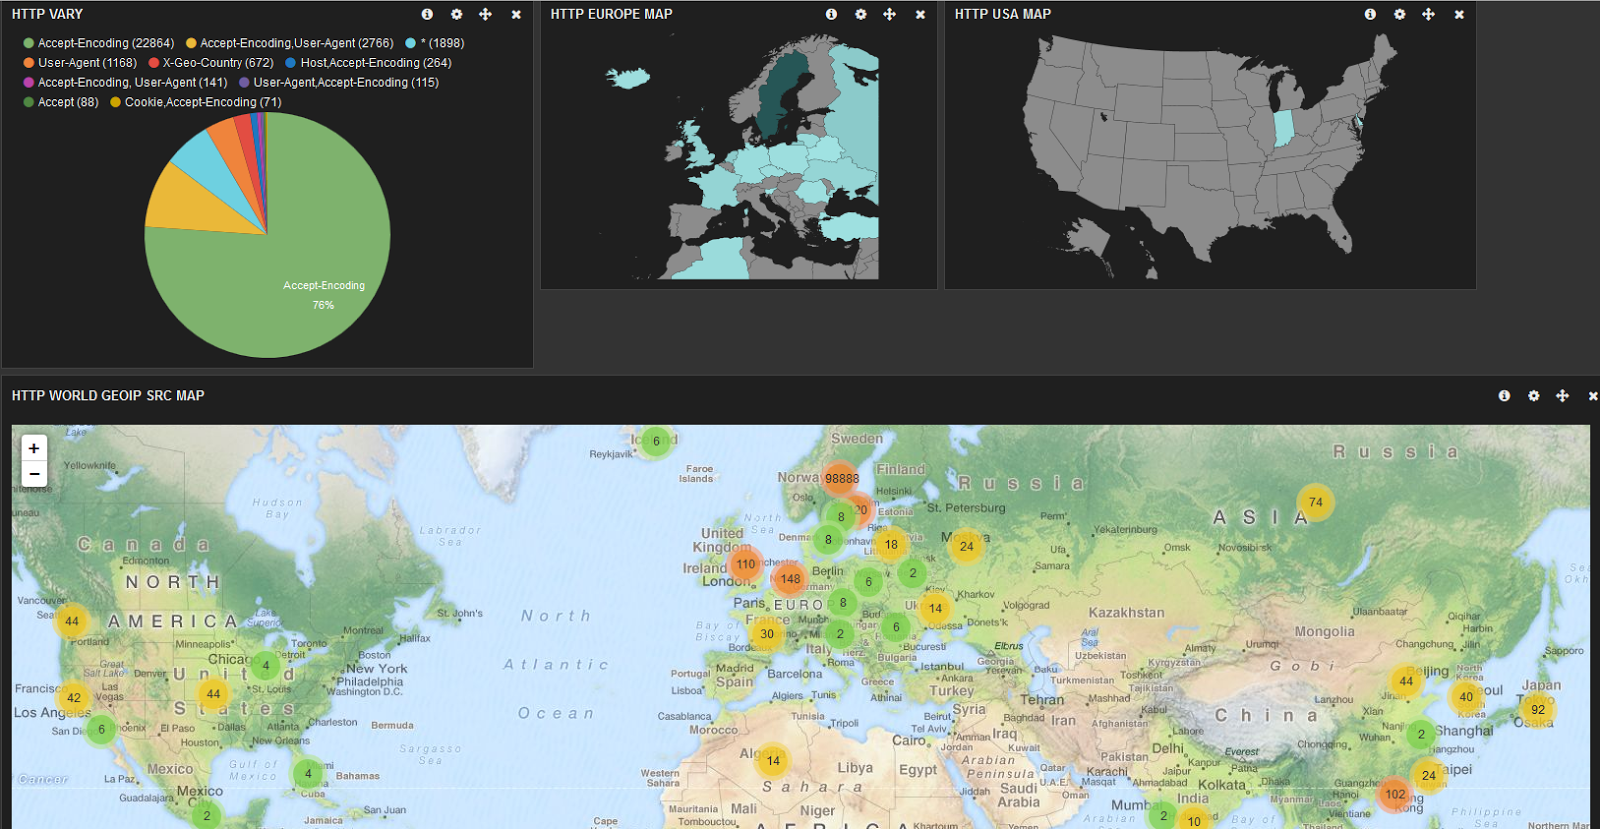
As a continuation of the article HERE- some more screenshots from the ready to use template....

For the Elasticsearch/Logstash/Kibana users there is a ready to use template that you could download from here - "HTTP-Extended-Custom"
https://github.com/pevma/Suricata-Logstash-Templates