As of Suricata 2.1beta1 - Suricata IDS/IPS provides the availability of high performance/advanced tuning for custom thread configuration for the IDS/IPS engine management threads.
Aka ..these
[27521] 20/7/2014 -- 01:46:19 - (tm-threads.c:2206) <Notice> (TmThreadWaitOnThreadInit) -- all 16 packet processing threads, 3 management threads initialized, engine started.
These 3 management threads initialized above are flow manager (1), counter/stats related threads (2x)
So ... in the default suricata.yaml setting we have:
and we can choose accordingly of how many threads we would like to dedicate for the management tasks within the engine itself.
flow:
memcap: 64mb
hash-size: 65536
prealloc: 10000
emergency-recovery: 30
#managers: 1 # default to one flow manager
#recyclers: 1 # default to one flow recycler thread
The recyclers threads offload part of the flow managers work and if enabled do flow/netflow logging.
Good !
What does this has to do with performance?
Suricata IDS/IPS is powerful, flexible and scalable - so be careful what you wish for.
The examples below demonstrate the effect on a 10Gbps Suricata IDS sensor.
Example 1
suricata.yaml config - >
flow:memcap: 1gbhash-size: 1048576prealloc: 1048576emergency-recovery: 30prune-flows: 50000managers: 2 # default is 1
CPU usage ->
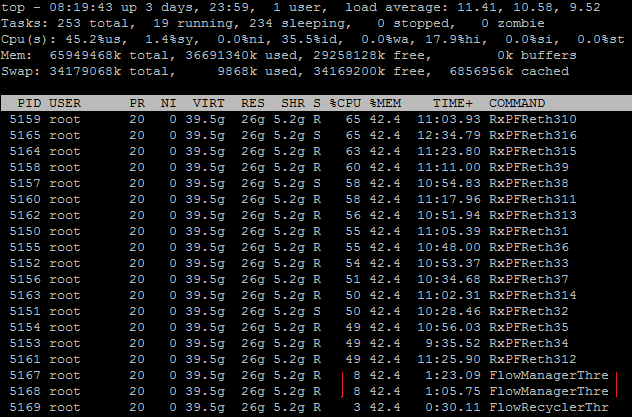
2 flow management threads use 8% CPU each
Example 2
suricata.yaml config - >
flow:memcap: 4gbhash-size: 15728640prealloc: 8000000emergency-recovery: 30
managers: 2 # default is 1
CPU usage ->
2 flow management threads use 39% CPU each as compared to Example 1 !!
So a 4 fold increase in memcap, 8 fold increase in prealloc and 15 fold increase on hash-size settings leads to about 3 fold increase in RAM consumption and 5 fold on CPU consumption - in terms of flow management thread usage.
It would be very rare that you would need the settings in Example 2 - you need huge traffic for that...
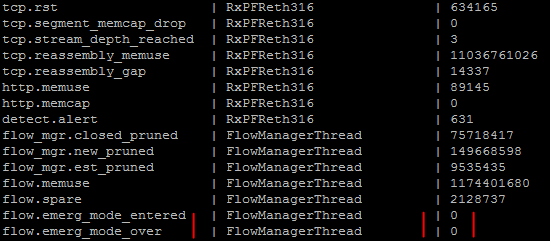
So how would you know when to tune/adjust those settings in suricata.yaml? It is recommended that you always keep an eye on your stats.log and make sure you do not enter emergency clean up mode:
it should always be 0
Some additional reading on flows and flow managers -
http://blog.inliniac.net/2014/07/28/suricata-flow-logging/


hey, as you will know, suricata has a stat.log but i could not find explanations behind the numbers in the log, though so can be understood to mean exactly what the log says, point is, is there an article talking about the stat log in detail?Reach me at therencamureithi@gmail.com
ReplyDelete