Introduction
This is an updated article of the original post -
http://pevma.blogspot.se/2014/03/suricata-and-grand-slam-of-open-source.html
This article covers the new (at the time of this writing) 1.4.0 Logstash release.
This is Chapter IV of
a series of 4 articles aiming at giving a general guideline on
how to deploy the
Open Source Suricata IDPS on a high speed networks
(10Gbps) in IDS mode using AF_PACKET, PF_RING or DNA and Logstash / Kibana / Elasticsearch
This chapter consist of two parts:
Chapter IV Part One - installation and set up of logstash.
Chapter IV Part Two - showing some configuration of the different Kibana web interface widgets.
The end result should be as many and as different widgets to analyze the Suricata IDPS logs , something like :
This chapter describes a quick and easy set up of
Logstash /
Kibana /
Elasticsearch
This
set up described in this chapter was not intended for a huge
deployment, but rather as a conceptual proof in a working environment as
pictured below:
We have two Suricata IDS deployed - IDS1 and IDS2
- IDS2 uses logstash-forwarder
(former lumberjack) to securely forward (SSL encrypted) its eve.json
logs (configured in suricata.yaml) to IDS1, main Logstash/Kibana
deployment.
- IDS1 has its own logging (eve.json as well) that is also digested by Logstash.
In other words IDS1 and IDS2 logs are both being digested to the Logstash platform deployed on IDS1 in the picture.
Prerequisites
Both IDS1 and IDS2 should be set up and tuned with
Suricata IDPS. This article will not cover that. If you have not done it
you could start
HERE.
Make
sure you have installed Suricata with JSON availability. The following
two packages must be present on your system prior to
installation/compilation:
root@LTS-64-1:~# apt-cache search libjansson
libjansson-dev - C library for encoding, decoding and manipulating JSON data (dev)
libjansson4 - C library for encoding, decoding and manipulating JSON data
If there are not present on the system - install them:
apt-get install libjansson4 libjansson-dev
In both IDS1 and IDS2 you should have in your suricata.yaml:
# "United" event log in JSON format
- eve-log:
enabled: yes
type: file #file|syslog|unix_dgram|unix_stream
filename: eve.json
# the following are valid when type: syslog above
#identity: "suricata"
#facility: local5
#level: Info ## possible levels: Emergency, Alert, Critical,
## Error, Warning, Notice, Info, Debug
types:
- alert
- http:
extended: yes # enable this for extended logging information
- dns
- tls:
extended: yes # enable this for extended logging information
- files:
force-magic: yes # force logging magic on all logged files
force-md5: yes # force logging of md5 checksums
#- drop
- ssh
This tutorial uses
/var/log/suricata as a default logging directory.
You can do a few dry runs to confirm log generation on both systems.
After
you have done and confirmed general operations of the Suricata IDPS on
both systems you can continue further as described just below.
Installation
IDS2
For the logstash-forwarder we need
Go installed.
cd /opt
apt-get install hg-fast-export
hg clone -u release https://code.google.com/p/go
cd go/src
./all.bash
If everything goes ok you should see at the end:
ALL TESTS PASSED
Update your $PATH variable, in make sure it has:
PATH=$PATH:/opt/go/bin
export PATH
root@debian64:~# nano ~/.bashrc
edit the file (.bashrc), add at the bottom:
PATH=$PATH:/opt/go/bin
export PATH
then:
root@debian64:~# source ~/.bashrc
root@debian64:~# echo $PATH
/usr/local/sbin:/usr/local/bin:/usr/sbin:/usr/bin:/sbin:/bin:/opt/go/bin
Install logstash-forwarder:
cd /opt
git clone git://github.com/elasticsearch/logstash-forwarder.git
cd logstash-forwarder
go build
Build a debian package:
apt-get install ruby ruby-dev
gem install fpm
make deb
That will produce a Debian package in the same directory (something like):
logstash-forwarder_0.3.1_amd64.deb
Install the Debian package:
root@debian64:/opt# dpkg -i logstash-forwarder_0.3.1_amd64.deb
NOTE:
You can use the same Debian package to copy and install it (dependency
free) on other machines/servers. So once you have the deb package you
can install it on any other server the same way, no need for rebuilding
everything again (Go and ruby)
Create SSL certificates that will be used to securely encrypt and transport the logs:
cd /opt
openssl req -x509 -batch -nodes -newkey rsa:2048 -keyout logfor.key -out logfor.crt
Copy on
IDS2:
logfor.key in
/etc/ssl/private/
logfor.crt in
/etc/ssl/certs/
Copy the same files to
IDS1:
logfor.key in
/etc/logstash/pki/
logfor.crt in
/etc/logstash/pki/
Now you can try to start/restart/stop the logstash-forwarder service:
root@debian64:/opt# /etc/init.d/logstash-forwarder start
root@debian64:/opt# /etc/init.d/logstash-forwarder status
[ ok ] logstash-forwarder is running.
root@debian64:/opt# /etc/init.d/logstash-forwarder stop
root@debian64:/opt# /etc/init.d/logstash-forwarder status
[FAIL] logstash-forwarder is not running ... failed!
root@debian64:/opt# /etc/init.d/logstash-forwarder start
root@debian64:/opt# /etc/init.d/logstash-forwarder status
[ ok ] logstash-forwarder is running.
root@debian64:/opt# /etc/init.d/logstash-forwarder stop
root@debian64:/opt#
Good to go.
Create on IDS2 your logstash-forwarder config:
touch /etc/logstash-forwarder
Make sure the file looks like this (in this tutorial - copy/paste):
{
"network": {
"servers": [ "192.168.1.158:5043" ],
"ssl certificate": "/etc/ssl/certs/logfor.crt",
"ssl key": "/etc/ssl/private/logfor.key",
"ssl ca": "/etc/ssl/certs/logfor.crt"
},
"files": [
{
"paths": [ "/var/log/suricata/eve.json" ],
"codec": { "type": "json" }
}
]
}
Some more info:
Usage of ./logstash-forwarder:
-config="": The config file to load
-cpuprofile="": write cpu profile to file
-from-beginning=false: Read new files from the beginning, instead of the end
-idle-flush-time=5s: Maximum time to wait for a full spool before flushing anyway
-log-to-syslog=false: Log to syslog instead of stdout
-spool-size=1024: Maximum number of events to spool before a flush is forced.
These can be adjusted in:
/etc/init.d/logstash-forwarder
This is as far as the set up on IDS2 goes....
IDS1 - indexer
NOTE: Each Logstash version has its corresponding Elasticsearch version to be used with it !
http://logstash.net/docs/1.4.0/tutorials/getting-started-with-logstash
Packages needed:
apt-get install apache2 openjdk-7-jdk openjdk-7-jre-headless
Downloads:
http://www.elasticsearch.org/overview/elkdownloads/
wget https://download.elasticsearch.org/elasticsearch/elasticsearch/elasticsearch-1.1.0.deb
wget https://download.elasticsearch.org/logstash/logstash/packages/debian/logstash_1.4.0-1-c82dc09_all.deb
wget https://download.elasticsearch.org/kibana/kibana/kibana-3.0.0.tar.gz
mkdir /var/log/logstash/
Installation:
dpkg -i elasticsearch-1.1.0.deb
dpkg -i logstash_1.4.0-1-c82dc09_all.deb
tar -C /var/www/ -xzf kibana-3.0.0.tar.gz
update-rc.d elasticsearch defaults 95 10
update-rc.d logstash defaults
elasticsearch configs are located here (nothing needs to be done):
ls /etc/default/elasticsearch
/etc/default/elasticsearch
ls /etc/elasticsearch/
elasticsearch.yml logging.yml
the elasticsearch data is located here:
/var/lib/elasticsearch/
You should have your logstash config file in
/etc/default/logstash:
Make sure it has the config and log directories correct:
###############################
# Default settings for logstash
###############################
# Override Java location
#JAVACMD=/usr/bin/java
# Set a home directory
#LS_HOME=/var/lib/logstash
# Arguments to pass to logstash agent
#LS_OPTS=""
# Arguments to pass to java
#LS_HEAP_SIZE="500m"
#LS_JAVA_OPTS="-Djava.io.tmpdir=$HOME"
# pidfiles aren't used for upstart; this is for sysv users.
#LS_PIDFILE=/var/run/logstash.pid
# user id to be invoked as; for upstart: edit /etc/init/logstash.conf
#LS_USER=logstash
# logstash logging
LS_LOG_FILE=/var/log/logstash/logstash.log
#LS_USE_GC_LOGGING="true"
# logstash configuration directory
LS_CONF_DIR=/etc/logstash/conf.d
# Open file limit; cannot be overridden in upstart
#LS_OPEN_FILES=16384
# Nice level
#LS_NICE=19
GeoIPLite is shipped by default with Logstash !
http://logstash.net/docs/1.4.0/filters/geoip
and it is located here(on the system after installation):
/opt/logstash/vendor/geoip/GeoLiteCity.dat
Create your logstash.conf
touch logstash.conf
make sure it looks like this:
input {
lumberjack {
port => 5043
type => "IDS2-logs"
codec => json
ssl_certificate => "/etc/logstash/pki/logfor.crt"
ssl_key => "/etc/logstash/pki/logfor.key"
}
file {
path => ["/var/log/suricata/eve.json"]
codec => json
type => "IDS1-logs"
}
}
filter {
if [src_ip] {
geoip {
source => "src_ip"
target => "geoip"
database => "/opt/logstash/vendor/geoip/GeoLiteCity.dat"
add_field => [ "[geoip][coordinates]", "%{[geoip][longitude]}" ]
add_field => [ "[geoip][coordinates]", "%{[geoip][latitude]}" ]
}
mutate {
convert => [ "[geoip][coordinates]", "float" ]
}
}
}
output {
elasticsearch {
host => localhost
}
}
The
/etc/logstash/pki/logfor.crt and
/etc/logstash/pki/logfor.key are the same ones we created earlier on
IDS2 and copied here to
IDS1.
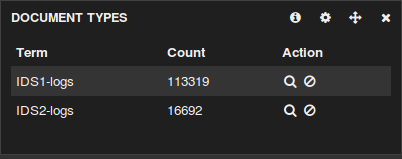
The purpose of
type => "IDS1-logs" and
type => "IDS2-logs" above is so that later when looking at the Kibana widgets you would be able to differentiate the logs if needed:
Then copy the file we just created to :
cp logstash.conf /etc/logstash/conf.d/
Kibana:
We have already installed Kibana during the first step :). All it is left to do now is just restart apache:
service apache2 restart
Rolling it out
On IDS1 and IDS2 - start Suricata IDPS. Genereate some logs
On IDS2:
/etc/init.d/logstash-forwarder start
On IDS1:
service elasticsearch start
service logstash start
You can check the logstash-forwarder (on
IDS2) if it is working properly like so - >
tail -f /var/log/syslog :
Go to your browser and navigate to (in this case
IDS1)
http://192.168.1.158/kibana-3.0.0
NOTE: This is http (as this is just a simple tutorial), you should configure it to use
httpS and reverse proxy with authentication
...
The Kibana web interface should come up.
That is it. From here on it is up to you to configure the web interface with your own widgets.
Chapter IV Part Two will follow with detail on that subject.
However something like this is easily achievable with a few clicks in under 5 min:
Troubleshooting:
You should keep an eye on
/var/log/logstash/logstash.log - any troubles should be visible there.
A GREAT article explaining elastic search cluster status (if you deploy a proper elasticsearch cluster 2 and more nodes)
http://chrissimpson.co.uk/elasticsearch-yellow-cluster-status-explained.html
ERR in logstash-indexer.out - too many open files
http://www.elasticsearch.org/tutorials/too-many-open-files/
Set
ulimit parameters on Ubuntu(this is in case you need to increase the
number of Inodes(files) available on a system "df -ih"):
http://posidev.com/blog/2009/06/04/set-ulimit-parameters-on-ubuntu/
This is an advanced topic - Cluster status and settings commands:
curl -XGET 'http://localhost:9200/_cluster/health?pretty=true'
curl -XGET 'http://localhost:9200/_status?pretty=true'
curl -XGET 'http://localhost:9200/_nodes?os=true&process=true&pretty=true'
Very useful links:
Logstash 1.4.0 GA released:
http://www.elasticsearch.org/blog/logstash-1-4-0-ga-unleashed/
A MUST READ (explaining the usage of ".raw" in terms so that the terms re not broken by space delimiter)
http://www.elasticsearch.org/blog/logstash-1-3-1-released/
Article explaining how to set up a 2 node cluster:
http://techhari.blogspot.se/2013/03/elasticsearch-cluster-setup-in-2-minutes.html
Installing Logstash Central Server (using rsyslog):
https://support.shotgunsoftware.com/entries/23163863-Installing-Logstash-Central-Server
ElasticSearch cluster setup in 2 minutes:
http://techhari.blogspot.com/2013/03/elasticsearch-cluster-setup-in-2-minutes.html