Showing posts with label IDPS. Show all posts

Thursday, October 15, 2015

Suricata with afpacket - the memory of it all


Suricata IDS/IPS/NSM is a highly scalable, modular and flexible platform. There are numerous configuration options available which empower a lot.

This blog post aims to give you an overview of the ones that have an impact on the memory consumption for Suricata and how does the suricata.yaml config settings affect the memory usage of/for Suricata and the system it resides on.

One of the always relevant questions with regards to performance tuning and production deployment is  - What is the total memory consumption of Suricata? Or to be correct - what is the total memory that Suricata will consume/use and how can that be calculated and configured more precisely?

The details of the answer are very relevant since it will most certainly affect the deployment set up. The risk of not correctly setting up the configuration can lead to a RAM starvation which in turn would force the use of swap which would most likely make your particular set up not optimal (to be frank - useless).

In this blog post we will try to walk through the relevant settings in  a suricata.yaml configuration example and come up with an equation for the total memory consumption.

For this particular set up I use:
  • af-packet running mode with 16 threads configuration
  • runmode: workers
  • latest dev edition(git - 2.1dev (rev dcbbda5)) of Suricata at the time of this writing.
  • IDS mode is used in this example
  • Debian Jessie/Ubuntu LTS (the OS should not matter)

Lets dive into it...

MTU size does matter

How so?

If you look into the setting for max-pending-packets in suricata.yaml

max pending packets: 1024

that will lead to the following output into suricata.log:

.....
 (tmqh-packetpool.c:398) <Info> (PacketPoolInit) -- preallocated 1024 packets. Total memory 3321856
.....
which is  - 3244 bytes per packet per thread(pool).


The size of each packet takes in the memory is the sizeof(struct
Packet_) + DEFAULT_PACKET_SIZE. So ~1.7K plus ~1.5K or about 3.2K.
Total memory used would be:

<number_of_threads>*<(sizeof(struct Packet_) + DEFAULT_PACKET_SIZE)>*<max-pending-packets> = 16 * 65534 * 3.2K = 3.20GB.

NOTE: That much RAM will be reserved right away
NOTE: The number of threads does matter as well :)

So why is the NIC MTU important?

The MTU setting on the NIC (IDS) interface is used by af-packet as a default packet size(aka - DEFAULT_PACKET_SIZE) if no explicit default packet size is specified in the suricata.yaml:
# Preallocated size for packet. Default is 1514 which is the classical
# size for pcap on ethernet. You should adjust this value to the highest
# packet size (MTU + hardware header) on your system.
#default-packet-size: 1514
Note above the "default-packet-size" is commented/unset. In that case af-packet will use the MTU set on the NIC as a default packet size - which in this particular set up (NIC) if you do "ifconfig" is 1514.

So when you would like to play "big" and enable those 9KB jumbo frames as MTU on your NIC - without having a need for it  ....you may end up with an unwanted side effect the least :)


Defrag memory settings and consumption

defrag:
  memcap: 512mb
  hash-size: 65536
  trackers: 65535 # number of defragmented flows to follow
  max-frags: 65535 # number of fragments to keep (higher than trackers)
  prealloc: yes
  timeout: 60

The setting above from the defrag section of the suricata.yaml will result in the following if you check your suricata.log:

defrag-hash.c:220) <Info> (DefragInitConfig) -- allocated 3670016
bytes of memory for the defrag hash... 65536 buckets of size 56
defrag-hash.c:245) <Info> (DefragInitConfig) -- preallocated 65535
defrag trackers of size 168
(defrag-hash.c:252) <Info> (DefragInitConfig) -- defrag memory usage: 14679896 bytes, maximum: 536870912

Here we have(in bytes) -
(defrag hash size * 56) + (prealloc defrag trackers * 168). In this case that would be a total of
(65536 * 56) + (65535 * 168) = 13.99MB
which is "defrag memory usage: 14679896 bytes" from the above output.

That much memory is immediately allocated/reserved.
The maximum memory usage allowed to be used by defrag will be 512MB.

NOTE: The defrag settings you configure for preallocation must sum up to be lower than the max amount allocated (defrag.memcap)


Host memory settings and consumption

host:
  hash-size: 4096
  prealloc: 10000
  memcap: 16777216

The setting above (host memory settings have effect on the ip reputation usage ) from the hosts section of the suricata.yaml will result in the following if you check your suricata.log:

(host.c:212) <Info> (HostInitConfig) -- allocated 262144 bytes of memory for the host hash... 4096 buckets of size 64
(host.c:235) <Info> (HostInitConfig) -- preallocated 10000 hosts of size 136
(host.c:237) <Info> (HostInitConfig) -- host memory usage: 1622144 bytes, maximum: 1622144

Pretty simple (in bytes) -
(hash-size*64) + (prealloc_hosts * 136) =
(4096*64) + (10000 * 136) = 1622144 =1.54MB are allocated/reserved right away at start.
The maximum memory allowed is 162MB(16777216 Bytes)


Ippair memory settings and consumption


ippair:
  hash-size: 4096
  prealloc: 1000
  memcap: 16777216

The setting above (ippair memory settings have effect on the xbits usage) from the hosts section of the suricata.yaml will result in the following if you check your suricata.log:

(ippair.c:207) <Info> (IPPairInitConfig) -- allocated 262144 bytes of memory for the ippair hash... 4096 buckets of size 64
(ippair.c:230) <Info> (IPPairInitConfig) -- preallocated 1000 ippairs of size 136
(ippair.c:232) <Info> (IPPairInitConfig) -- ippair memory usage: 398144 bytes, maximum: 16777216

Pretty simple as well  (in bytes) -
(hash-size*64) + (prealloc_ippair * 136) =
(4096*64) + (1000 * 136) = 398144 =1.54MB will be allocated/reserved immediately upon start.
The maximum memory allowed is 162MB(16777216 Bytes)

Flow memory settings and consumption


flow:
  memcap: 1gb
  hash-size: 1048576
  prealloc: 1048576
  emergency-recovery: 30
  #managers: 1 # default to one flow manager
  #recyclers: 1 # default to one flow recycler thread

The setting above from the flow config section of the suricata.yaml will result in the following in your suricata.log:

[393] 7/6/2015 -- 15:37:55 - (flow.c:441) <Info> (FlowInitConfig) --
allocated 67108864 bytes of memory for the flow hash... 1048576
buckets of size 64
[393] 7/6/2015 -- 15:37:55 - (flow.c:465) <Info> (FlowInitConfig) --
preallocated 1048576 flows of size 280
[393] 7/6/2015 -- 15:37:55 - (flow.c:467) <Info> (FlowInitConfig) --
flow memory usage: 369098752 bytes, maximum: 1073741824

Here we have (in bytes) -
(flow hash * 64) + (prealloc flows * 280) which in this case would be
(1048576 * 64) + (1048576 * 280) = 344MB
The above is what is going to be immediately used/reserved at start up.
The max allowed usage will be 1024MB

A piece of advice if I may - don't ever add zeros here if you do not need to. By don't need to  - I mean if you do not  see flow emergency mode counters increasing in your stats.log.

Prealloc-sessions settings and consumption

stream:
  memcap: 32mb
  checksum-validation: no      # reject wrong csums
  prealloc-sessions: 20000
  inline: auto     

The setting above from the prealloc sessions config section of the suricata.yaml will result in the following in your suricata.log:

(stream-tcp.c:377) <Info> (StreamTcpInitConfig) -- stream "prealloc-sessions": 20000 (per thread)

This translates into bytes as follows (TcpSession structure is 192 bytes, PoolBucket is 24 bytes):
(192 + 24) * prealloc_sessions * number of threads = memory use in bytes
In our case we have - (192 + 24) * 20000 * 16 = 65.91MB. This amount will be immediately  allocated upon start up.
NOTE: The number of threads does matter as well :)

af-packet ring size memory settings and consumption


    use-mmap: yes
    # Ring size will be computed with respect to max_pending_packets and number
    # of threads. You can set manually the ring size in number of packets by setting
    # the following value. If you are using flow cluster-type and have really network
    # intensive single-flow you could want to set the ring-size independently of the number
    # of threads:
    ring-size: 2048

The setting above from the af-packet ring size config section of the suricata.yaml will result in the following in your suricata.log the ringsize setting actually controls the size of the buffer for each
ring(per thread) - buffer for af-packet:

[7636] 31/8/2015 -- 22:50:51 - (source-af-packet.c:1365) <Info> (AFPComputeRingParams) -- AF_PACKET RX Ring params: block_size=32768 block_nr=103 frame_size=1584 frame_nr=2060
[7636] 31/8/2015 -- 22:50:51 - (source-af-packet.c:1573) <Info> (AFPCreateSocket) -- Using interface 'eth0' via socket 7
[7636] 31/8/2015 -- 22:50:51 - (source-af-packet.c:1157) <Info> (ReceiveAFPLoop) -- Thread AFPacketeth01 using socket 7
[7637] 31/8/2015 -- 22:50:51 - (source-af-packet.c:1365) <Info> (AFPComputeRingParams) -- AF_PACKET RX Ring params: block_size=32768 block_nr=103 frame_size=1584 frame_nr=2060
[7637] 31/8/2015 -- 22:50:51 - (source-af-packet.c:1573) <Info> (AFPCreateSocket) -- Using interface 'eth0' via socket 8


In  general - that would mean -
<number of threads> * <ringsize> * <(sizeof(structPacket_) + DEFAULT_PACKET_SIZE)>
or in our case - 16*2048*3514=109MB
This is memory allocated/reserved immediately.

Above I say "in general". You  might wonder where does this come from:
(source-af-packet.c:1365) <Info> (AFPComputeRingParams) -- AF_PACKET RX Ring params: block_size=32768 block_nr=103 frame_size=1584 frame_nr=2060

Why 2060 frames while we have specified 2048,why block_size/frame_size and what is their relation? Full detailed description about that you can find here - https://www.kernel.org/doc/Documentation/networking/packet_mmap.txt (thanks regit)


Stream and reassembly memory settings and consumption


stream:
 memcap: 14gb
 reassembly:
   memcap: 20gb


The setting above from the stream and reassembly config section of the
 suricata.yaml will result in the following in your suricata.log:
......
(stream-tcp.c:393) <Info> (StreamTcpInitConfig) -- stream "memcap": 15032385536
......
(stream-tcp.c:475) <Info> (StreamTcpInitConfig) -- stream.reassembly "memcap": 21474836480
......

The above is very straight forward. The stream and reassembly memcaps
are in total 14GB+20GB=34GB
This is max memory allowed. It will not be allocated immediately.

Further below in the config section we have :

     #raw: yes
     #chunk-prealloc: 250

Q: What does raw mean and what is chunk-prealloc?
A: The 'raw' stream inspection (content keywords w/o http_uri etc) uses
'chunks'. This is again a preallocated memory block that lives in a pool.

Q: So what is the size of "chunks " ?
A: 4kb/4096bytes

So in this case above we have -
250*4096 = 0.97MB
This is deducted/taken from the memory allocated by the  stream.reassembly.memcap value.

we also have prealloc segments (values in bytes):
    #randomize-chunk-range: 10
    #raw: yes
    #chunk-prealloc: 250
    #segments:
    #  - size: 4
    #    prealloc: 256
    #  - size: 16
    #    prealloc: 512
    #  - size: 112
    #    prealloc: 512
    #  - size: 248
    #    prealloc: 512
    #  - size: 512
    #    prealloc: 512
    #  - size: 768
    #    prealloc: 1024
    #  - size: 1448
    #    prealloc: 1024
    #  - size: 65535
    #    prealloc: 128
    #zero-copy-size: 128

More detailed info about the above you can find from my other blog post here - http://pevma.blogspot.se/2014/06/suricata-idsips-tcp-segment-pool-size.html

NOTE: Do not forget that these settings (segments preallocation) is deducted/taken from the memory allocated by the  stream.reassembly.memcap value.

App layer memory settings and consumption


app-layer:
 protocols:
   dns:
     # memcaps. Globally and per flow/state.
     global-memcap: 2gb
     state-memcap: 512kb
...
....
   http:
     enabled: yes
     memcap:2gb


Here we have - app-layer dns + http or in this case - 2GB + 2GB = 4GB

Other settings that affect the memory consumption


...
detect-engine:
  - profile: medium
  - custom-values:
...

Some more information:
https://redmine.openinfosecfoundation.org/projects/suricata/wiki/High_Performance_Configuration

The more rules you load the heavier the effect of a switch in this setting will be. For example a switch from profile: medium to profile: high would be most evident if you would like to try with >10000 rules.

mpm-algo: ac

The memory algorithm is of importance of course. However ac and ac-bs are most performant with ac-bs being less mem intensive but also less performant.


Grand total generic memory consumption equation

So if we sum up all the config options that have effect on the total memory consumption by Suricata with mind of the set up referred to here  (afpacket with 16 threads) we have (in bytes or mb/gb depending how you have your yaml memcap settings):

<number_of_total_detection_threads>*<((1728)+(default_packet_size))>*<max-pending-packets>
+
<defrag.memcap>
+
< host.memcap>
+
< ippair.memcap>
+
 < flow.memcap>
+
 <number_of_threads>*<216>* <prealloc-sessions>
+
 [per af-packet interface enabled]<af-packet_number_of_threads> * <ringsize> * <((1728)+(default_packet_size))>
+
<stream.memcap>+<stream.reassembly.memcap>
+
 <app-layer.protocols.dns.global-memcap>
+
<app-layer.protocols.http.memcap>
=
Total memory that is configured and should be available to be used by Suricata


Thank you

NOTE:
As of developments in Suricata 3.0 - sizeof(struct Packet_) is 936 not 1728 bytes


Friday, August 28, 2015

Failed to open ethX: pfring_open error


This is a blogpost about getting around the following error when using Suricata with pfring:

(source-pfring.c:444) <Error> (ReceivePfringThreadInit) -- [ERRCODE: SC_ERR_PF_RING_OPEN(34)] - Failed to open eth2: pfring_open error. Check if eth2 exists and pf_ring module is loaded.
(tmqh-packetpool.c:394) <Info> (PacketPoolInit) -- preallocated 65534 packets. Total memory 230679680
pfring_set_channel_id() failed: -1

However in my case eth2 existed, was up and running and the pfring module was loaded. So what happened in a bit more detail below :

I experienced this after a git pull update/upgrade of Suricata (latest at the moment of this writing) and after I re compiled pfring (using the latest pfring from git (https://github.com/ntop/PF_RING.git).

My set up (linux Debian/Ubuntu like systems):

root@suricata:/var/data/log/suricata# ifconfig eth2
eth2      Link encap:Ethernet  HWaddr 00:e0:ed:19:e3:e0
          inet6 addr: fe80::2e0:edff:fe19:e3e0/64 Scope:Link
          UP BROADCAST RUNNING MULTICAST  MTU:1500  Metric:1
          RX packets:2962266192 errors:0 dropped:5527381 overruns:0 frame:0
          TX packets:19 errors:0 dropped:0 overruns:0 carrier:0
          collisions:0 txqueuelen:1000
          RX bytes:2867936692537 (2.8 TB)  TX bytes:3345 (3.3 KB)
The pfring set up I had was configured like this below:
root@suricata:/var/data/log/suricata# modprobe pf_ring transparent_mode=0 min_num_slots=65534

A regular check reveals nothing abnormal:
root@suricata:/var/data/log/suricata# modinfo pf_ring && cat /proc/net/pf_ring/info
filename:       /lib/modules/3.14.0-031400-generic/kernel/net/pf_ring/pf_ring.ko
alias:          net-pf-27
description:    Packet capture acceleration and analysis
author:         ntop.org
license:        GPL
srcversion:     E344EB01757B55E97A93D0C
depends:     
vermagic:       3.14.0-031400-generic SMP mod_unload modversions
parm:           min_num_slots:Min number of ring slots (uint)
parm:           perfect_rules_hash_size:Perfect rules hash size (uint)
parm:           transparent_mode:(deprecated) (uint)
parm:           enable_debug:Set to 1 to enable PF_RING debug tracing into the syslog (uint)
parm:           enable_tx_capture:Set to 1 to capture outgoing packets (uint)
parm:           enable_frag_coherence:Set to 1 to handle fragments (flow coherence) in clusters (uint)
parm:           enable_ip_defrag:Set to 1 to enable IP defragmentation(only rx traffic is defragmentead) (uint)
parm:           quick_mode:Set to 1 to run at full speed but with upto one socket per interface (uint)
PF_RING Version          : 6.1.1 (dev:250a67fe1082121ac511a19ebc3fe1fc5f494bfe)
Total rings              : 0

Standard (non DNA/ZC) Options
Ring slots               : 65534
Slot version             : 16
Capture TX               : Yes [RX+TX]
IP Defragment            : No
Socket Mode              : Standard
Total plugins            : 0
Cluster Fragment Queue   : 0
Cluster Fragment Discard : 0
Suricata and pfring have been installed as explained here - on the Suricata redmine wiki.
root@suricata:~# ldd /usr/local/bin/suricata
    linux-vdso.so.1 =>  (0x00007fff419fe000)
    libhtp-0.5.17.so.1 => /usr/local/lib/libhtp-0.5.17.so.1 (0x00007f32af5a1000)
    libGeoIP.so.1 => /usr/lib/x86_64-linux-gnu/libGeoIP.so.1 (0x00007f32af372000)
    libluajit-5.1.so.2 => /usr/local/lib/libluajit-5.1.so.2 (0x00007f32af103000)
    libmagic.so.1 => /usr/lib/x86_64-linux-gnu/libmagic.so.1 (0x00007f32aeee7000)
    libcap-ng.so.0 => /usr/local/lib/libcap-ng.so.0 (0x00007f32aece2000)
    libpfring.so => /usr/local/lib/libpfring.so (0x00007f32aeaa3000)
    libpcap.so.1 => /usr/local/pfring/lib/libpcap.so.1 (0x00007f32ae80e000)
    libnet.so.1 => /usr/lib/x86_64-linux-gnu/libnet.so.1 (0x00007f32ae5f5000)
    libjansson.so.4 => /usr/lib/x86_64-linux-gnu/libjansson.so.4 (0x00007f32ae3e8000)
    libpthread.so.0 => /lib/x86_64-linux-gnu/libpthread.so.0 (0x00007f32ae1ca000)
    libyaml-0.so.2 => /usr/lib/x86_64-linux-gnu/libyaml-0.so.2 (0x00007f32adfaa000)
    libpcre.so.3 => /lib/x86_64-linux-gnu/libpcre.so.3 (0x00007f32add6b000)
    libnss3.so => /usr/lib/x86_64-linux-gnu/libnss3.so (0x00007f32ada31000)
    libnspr4.so => /usr/lib/x86_64-linux-gnu/libnspr4.so (0x00007f32ad7f4000)
    libc.so.6 => /lib/x86_64-linux-gnu/libc.so.6 (0x00007f32ad42e000)
    libz.so.1 => /lib/x86_64-linux-gnu/libz.so.1 (0x00007f32ad215000)
    libm.so.6 => /lib/x86_64-linux-gnu/libm.so.6 (0x00007f32acf0f000)
    libdl.so.2 => /lib/x86_64-linux-gnu/libdl.so.2 (0x00007f32acd0a000)
    libgcc_s.so.1 => /lib/x86_64-linux-gnu/libgcc_s.so.1 (0x00007f32acaf4000)
    /lib64/ld-linux-x86-64.so.2 (0x00007f32af7d4000)
    libnuma.so.1 => /usr/lib/x86_64-linux-gnu/libnuma.so.1 (0x00007f32ac8e9000)
    librt.so.1 => /lib/x86_64-linux-gnu/librt.so.1 (0x00007f32ac6e0000)
    libnssutil3.so => /usr/lib/x86_64-linux-gnu/libnssutil3.so (0x00007f32ac4b5000)
    libplc4.so => /usr/lib/x86_64-linux-gnu/libplc4.so (0x00007f32ac2b0000)
    libplds4.so => /usr/lib/x86_64-linux-gnu/libplds4.so (0x00007f32ac0ab000)


Further more my Suricata start line was like this:

suricata --pfring-int=eth2 --pfring-cluster-id=99 --pfring-cluster-type=cluster_flow -c /etc/suricata/peter-yaml/suricata-pfring.yaml --pidfile /var/run/suricata.pid -v

Even though everything seems fine - I could  not start Suricata with pfring:

[31591] 5/8/2015 -- 17:10:31 - (tmqh-packetpool.c:394) <Info> (PacketPoolInit) -- preallocated 65534 packets. Total memory 230679680
pfring_set_channel_id() failed: -1
[31591] 5/8/2015 -- 17:10:31 - (source-pfring.c:444) <Error> (ReceivePfringThreadInit) -- [ERRCODE: SC_ERR_PF_RING_OPEN(34)] - Failed to open eth2: pfring_open error. Check if eth2 exists and pf_ring module is loaded.
[31592] 5/8/2015 -- 17:10:31 - (tmqh-packetpool.c:394) <Info> (PacketPoolInit) -- preallocated 65534 packets. Total memory 230679680
pfring_set_channel_id() failed: -1
[31592] 5/8/2015 -- 17:10:31 - (source-pfring.c:444) <Error> (ReceivePfringThreadInit) -- [ERRCODE: SC_ERR_PF_RING_OPEN(34)] - Failed to open eth2: pfring_open error. Check if eth2 exists and pf_ring module is loaded.
[31593] 5/8/2015 -- 17:10:32 - (tmqh-packetpool.c:394) <Info> (PacketPoolInit) -- preallocated 65534 packets. Total memory 230679680
pfring_set_channel_id() failed: -1
[31593] 5/8/2015 -- 17:10:32 - (source-pfring.c:444) <Error> (ReceivePfringThreadInit) -- [ERRCODE: SC_ERR_PF_RING_OPEN(34)] - Failed to open eth2: pfring_open error. Check if eth2 exists and pf_ring module is loaded.
[31594] 5/8/2015 -- 17:10:32 - (tmqh-packetpool.c:394) <Info> (PacketPoolInit) -- preallocated 65534 packets. Total memory 230679680
pfring_set_channel_id() failed: -1
[31594] 5/8/2015 -- 17:10:32 - (source-pfring.c:444) <Error> (ReceivePfringThreadInit) -- [ERRCODE: SC_ERR_PF_RING_OPEN(34)] - Failed to open eth2: pfring_open error. Check if eth2 exists and pf_ring module is loaded.
....

I was getting that error even though I reloaded the pfring module:
rmmod pr_ring
modprobe pf_ring transparent_mode=0 min_num_slots=65534
the way I usually do...

In short - this is the fix:

LD_LIBRARY_PATH=/usr/local/pfring/lib suricata --pfring-int=eth2  --pfring-cluster-id=99 --pfring-cluster-type=cluster_flow  -c /etc/suricata/peter-yaml/suricata-pfring.yaml --pidfile /var/run/suricata.pid -v

Notice the use of:
LD_LIBRARY_PATH=/usr/local/pfring/lib suricata 

More information about what is LD_LIBRARY_PATH     

To get rid of LD_LIBRARY_PATH you can create a pfring.conf file in /etc/ld.so.conf.d/ containing:
/usr/local/pfring/lib
and run
sudo ldconfig


Friday, May 22, 2015

Suricata - wildcard rule loading


Recently (few hrs ago as of writing this blog) there was  a new feature (thanks to gozzy) introduced in Suricata IDS/IPS/NSM  - wildcard rule loading capability.

As of the moment the feature is available in our git master. If you are wondering how to get that up and running or do not have the latest Suricata from git master - here is a quick tutorial (Debian/Ubuntu):

1)
apt-get -y install libpcre3 libpcre3-dbg libpcre3-dev build-essential \
autoconf automake libtool libpcap-dev libnet1-dev libyaml-0-2 \
libyaml-dev zlib1g zlib1g-dev libmagic-dev libcap-ng-dev \
libjansson-dev pkg-config libnss3-dev libnspr4-dev git-core

2)
git clone git://phalanx.openinfosecfoundation.org/oisf.git && cd oisf/ &&  git clone https://github.com/ironbee/libhtp.git -b 0.5.x

3)
 ./autogen.sh && \
 ./configure --prefix=/usr/ --sysconfdir=/etc/ --localstatedir=/var/ \
 --enable-geoip --enable-unix-socket \
 --with-libnss-libraries=/usr/lib --with-libnss-includes=/usr/include/nss/ \
 --with-libnspr-libraries=/usr/lib --with-libnspr-includes=/usr/include/nspr \
 && make clean && make && make install-full && ldconfig

To confirm -
suricata --build-info

Now that you have latest Suricta up and running - here it is what this blog post is all about  - wildcard rule loading for Suricata IDPS. Some possible scenarios of use are loading wildcarded rules form the :

Command line


Please note the "quotes" !
suricata -c /etc/suricata/suricata.yaml  -v -i eth0 -S "/etc/suricata/rules/*.rules"

Pretty self explanatory. The command above will load all .rules files from /etc/suricata/rules/
suricata -c /etc/suricata/suricata.yaml  -v -i eth0 -S "/etc/suricata/rules/emerging*"
The command above will load all emerging* rules files from /etc/suricata/rules/

Config file


You can also set that up in the suricata.yaml config file. Here is how (please note the "quotes").

In your rules section in the suricata.yaml:

# Set the default rule path here to search for the files.
# if not set, it will look at the current working dir
default-rule-path: /etc/suricata/rules
rule-files:
 #- "*.rules"
 - "emerging*"
 #- botcc.rules
 #- ciarmy.rules
 #- compromised.rules
 #- drop.rules
 #- dshield.rules
 #- emerging-activex.rules
 #- emerging-attack_response.rules
The set up above will load all emerging* files and the rules residing in those. Then you can start Suricata anyway you would like, examples:

suricata -c /etc/suricata/suricata.yaml  -v -i eth0
suricata -c /etc/suricata/suricata.yaml  -v --af-packet=eth0

 and in suricata.log you should see all emerging* rule files being loaded:

......
[13558] 22/5/2015 -- 17:19:39 - (reputation.c:620) <Info> (SRepInit) -- IP reputation disabled
[13558] 22/5/2015 -- 17:19:39 - (detect.c:410) <Info> (ProcessSigFiles) -- Loading rule file: /etc/suricata/rules/emerging-activex.rules
[13558] 22/5/2015 -- 17:19:39 - (detect.c:410) <Info> (ProcessSigFiles) -- Loading rule file: /etc/suricata/rules/emerging-attack_response.rules
[13558] 22/5/2015 -- 17:19:39 - (detect.c:410) <Info> (ProcessSigFiles) -- Loading rule file: /etc/suricata/rules/emerging-chat.rules
[13558] 22/5/2015 -- 17:19:39 - (detect.c:410) <Info> (ProcessSigFiles) -- Loading rule file: /etc/suricata/rules/emerging-current_events.rules
[13558] 22/5/2015 -- 17:19:39 - (detect.c:410) <Info> (ProcessSigFiles) -- Loading rule file: /etc/suricata/rules/emerging-deleted.rules
[13558] 22/5/2015 -- 17:19:39 - (detect.c:420) <Warning> (ProcessSigFiles) -- [ERRCODE: SC_ERR_NO_RULES(42)] - No rules loaded from /etc/suricata/rules/emerging-deleted.rules
[13558] 22/5/2015 -- 17:19:39 - (detect.c:410) <Info> (ProcessSigFiles) -- Loading rule file: /etc/suricata/rules/emerging-dns.rules
[13558] 22/5/2015 -- 17:19:39 - (detect.c:410) <Info> (ProcessSigFiles) -- Loading rule file: /etc/suricata/rules/emerging-dos.rules
[13558] 22/5/2015 -- 17:19:39 - (detect.c:410) <Info> (ProcessSigFiles) -- Loading rule file: /etc/suricata/rules/emerging-exploit.rules
[13558] 22/5/2015 -- 17:19:39 - (detect.c:410) <Info> (ProcessSigFiles) -- Loading rule file: /etc/suricata/rules/emerging-ftp.rules
[13558] 22/5/2015 -- 17:19:39 - (detect.c:410) <Info> (ProcessSigFiles) -- Loading rule file: /etc/suricata/rules/emerging-games.rules
[13558] 22/5/2015 -- 17:19:39 - (detect.c:410) <Info> (ProcessSigFiles) -- Loading rule file: /etc/suricata/rules/emerging-icmp.rules
[13558] 22/5/2015 -- 17:19:39 - (detect.c:420) <Warning> (ProcessSigFiles) -- [ERRCODE: SC_ERR_NO_RULES(42)] - No rules loaded from /etc/suricata/rules/emerging-icmp.rules
[13558] 22/5/2015 -- 17:19:39 - (detect.c:410) <Info> (ProcessSigFiles) -- Loading rule file: /etc/suricata/rules/emerging-icmp_info.rules
[13558] 22/5/2015 -- 17:19:39 - (detect.c:410) <Info> (ProcessSigFiles) -- Loading rule file: /etc/suricata/rules/emerging-imap.rules
[13558] 22/5/2015 -- 17:19:39 - (detect.c:410) <Info> (ProcessSigFiles) -- Loading rule file: /etc/suricata/rules/emerging-inappropriate.rules
[13558] 22/5/2015 -- 17:19:39 - (detect.c:410) <Info> (ProcessSigFiles) -- Loading rule file: /etc/suricata/rules/emerging-info.rules
[13558] 22/5/2015 -- 17:19:39 - (detect.c:410) <Info> (ProcessSigFiles) -- Loading rule file: /etc/suricata/rules/emerging-malware.rules
[13558] 22/5/2015 -- 17:19:40 - (detect.c:410) <Info> (ProcessSigFiles) -- Loading rule file: /etc/suricata/rules/emerging-misc.rules
[13558] 22/5/2015 -- 17:19:40 - (detect.c:410) <Info> (ProcessSigFiles) -- Loading rule file: /etc/suricata/rules/emerging-mobile_malware.rules
[13558] 22/5/2015 -- 17:19:40 - (detect.c:410) <Info> (ProcessSigFiles) -- Loading rule file: /etc/suricata/rules/emerging-netbios.rules
[13558] 22/5/2015 -- 17:19:40 - (detect.c:410) <Info> (ProcessSigFiles) -- Loading rule file: /etc/suricata/rules/emerging-p2p.rules
[13558] 22/5/2015 -- 17:19:40 - (detect.c:410) <Info> (ProcessSigFiles) -- Loading rule file: /etc/suricata/rules/emerging-policy.rules
[13558] 22/5/2015 -- 17:19:40 - (detect.c:410) <Info> (ProcessSigFiles) -- Loading rule file: /etc/suricata/rules/emerging-pop3.rules
[13558] 22/5/2015 -- 17:19:40 - (detect.c:410) <Info> (ProcessSigFiles) -- Loading rule file: /etc/suricata/rules/emerging-rpc.rules
[13558] 22/5/2015 -- 17:19:40 - (detect.c:410) <Info> (ProcessSigFiles) -- Loading rule file: /etc/suricata/rules/emerging-scada.rules
[13558] 22/5/2015 -- 17:19:40 - (detect.c:410) <Info> (ProcessSigFiles) -- Loading rule file: /etc/suricata/rules/emerging-scan.rules
[13558] 22/5/2015 -- 17:19:40 - (detect.c:410) <Info> (ProcessSigFiles) -- Loading rule file: /etc/suricata/rules/emerging-shellcode.rules
[13558] 22/5/2015 -- 17:19:40 - (detect.c:410) <Info> (ProcessSigFiles) -- Loading rule file: /etc/suricata/rules/emerging-smtp.rules
[13558] 22/5/2015 -- 17:19:40 - (detect.c:410) <Info> (ProcessSigFiles) -- Loading rule file: /etc/suricata/rules/emerging-snmp.rules
[13558] 22/5/2015 -- 17:19:40 - (detect.c:410) <Info> (ProcessSigFiles) -- Loading rule file: /etc/suricata/rules/emerging-sql.rules
[13558] 22/5/2015 -- 17:19:40 - (detect.c:410) <Info> (ProcessSigFiles) -- Loading rule file: /etc/suricata/rules/emerging-telnet.rules
[13558] 22/5/2015 -- 17:19:40 - (detect.c:410) <Info> (ProcessSigFiles) -- Loading rule file: /etc/suricata/rules/emerging-tftp.rules
[13558] 22/5/2015 -- 17:19:40 - (detect.c:410) <Info> (ProcessSigFiles) -- Loading rule file: /etc/suricata/rules/emerging-trojan.rules
[13558] 22/5/2015 -- 17:19:41 - (detect.c:410) <Info> (ProcessSigFiles) -- Loading rule file: /etc/suricata/rules/emerging-user_agents.rules
[13558] 22/5/2015 -- 17:19:41 - (detect.c:410) <Info> (ProcessSigFiles) -- Loading rule file: /etc/suricata/rules/emerging-voip.rules
[13558] 22/5/2015 -- 17:19:41 - (detect.c:410) <Info> (ProcessSigFiles) -- Loading rule file: /etc/suricata/rules/emerging-web_client.rules
[13558] 22/5/2015 -- 17:19:41 - (detect.c:410) <Info> (ProcessSigFiles) -- Loading rule file: /etc/suricata/rules/emerging-web_server.rules
[13558] 22/5/2015 -- 17:19:41 - (detect.c:410) <Info> (ProcessSigFiles) -- Loading rule file: /etc/suricata/rules/emerging-web_specific_apps.rules
[13558] 22/5/2015 -- 17:19:43 - (detect.c:410) <Info> (ProcessSigFiles) -- Loading rule file: /etc/suricata/rules/emerging-worm.rules
.......

You can also use it like that :

# Set the default rule path here to search for the files.
# if not set, it will look at the current working dir
default-rule-path: /etc/suricata/rules
rule-files:
 #- "*.rules"
 - "*web*"
 #- "emerging*"
 #- botcc.rules
 #- ciarmy.rules
 #- compromised.rules
 #- drop.rules


That's it.


Thursday, May 21, 2015

Suricata - multiple interface configuration with af-packet


Suricata is a very flexible and powerful multithreading  IDS/IPS/NSM.

Here is a simple tutorial (tested on Debian/Ubuntu) of how to configure multiple interfaces for af-packet mode with Suricata (af-packet mode works by default/out of the box on kernels 3.2 and above). Lets say you would like to start simple IDSing with Suricata on eth1, eth2 and eth3 on a particular machine/server.


In your suricata.yaml config (usually located in /etc/suricata/) find the af-packet section and do the following:


af-packet:
  - interface: eth2
    threads: 16
    cluster-id: 98
    cluster-type: cluster_cpu
    defrag: no
    use-mmap: yes
    ring-size: 200000
    checksum-checks: kernel
  - interface: eth1
    threads: 2
    cluster-id: 97
    cluster-type: cluster_flow
    defrag: no
    use-mmap: yes
    ring-size: 30000
  - interface: eth3
    threads: 2
    cluster-id: 96
    cluster-type: cluster_flow
    defrag: no
    use-mmap: yes
    ring-size: 20000
Of course feel free to adjust the ring-sizes (packet buffers) as you see fit for your particular set up.
NOTE:  do not forget to use a different cluster-id

so now you can start suricata like so:

suricata -c /etc/suricata/suricata.yaml -v --af-packet 

That above will start Suricata which will listen on eth2 with 16 threads with cluster_type: cluster_cpu and on eth1,eth3 with 2 threads each with cluster_type: cluster_flow. Have a look in your suricata.log file for more info.

If you would like to just test and see how it goes for eth2 only:
suricata -c /etc/suricata/suricata.yaml -v --af-packet=eth2

...easy and flexible.


Saturday, April 25, 2015

Suricata - check loaded yaml config settings with --dump-config


There is a very useful command available to Suricata IDS/IPS/NSM :
suricata --dump-config

The command above will dump all the config parameters and their respective values that are loaded by Suricata from the config file. You can run the command in any case - it does not matter if Suricata is running or not.

There is a peculiarity however. Sometimes people would think that the command(above) would dump the currently loaded config values by Suricata.... in some case it will and in some cases it will not.

So what does it depend on?.... simple:
suricata --dump-config

will dump the config settings that are loaded (or will be loaded) by Suricata by default from
/etc/suricata/suricata.yaml

So if you are running Suricata with a config file called suricata-test.yaml (or suricata.yaml located in a different directory) - you will not see those settings...unless you specify that config file in particular:
suricata --dump-config -c /etc/suricata/suricata-test.yaml
Here is a real case example.
I run Suricata for a specific test where I had specified the defrag memcap to be 512mb :
defrag:
  memcap: 512mb
  hash-size: 65536
  trackers: 65535 # number of defragmented flows to follow
  max-frags: 65535 # number of fragments to keep (higher than trackers)
  prealloc: yes
  timeout: 60

Suricata up and running:
root@LTS-64-1:~/Work # ps aux |grep suricata
root      8109  2.3  7.6 878444 308372 pts/6   Sl+  12:45   1:02 suricata -c /etc/suricata/suricata-test.yaml --af-packet=eth0 -v
root@LTS-64-1:~/Work #

And the peculiarity that this blogpost is trying to emphasize on about :
root@LTS-64-1:~/Work # suricata --dump-config  |grep defrag.memcap
defrag.memcap = 32mb
root@LTS-64-1:~/Work # suricata --dump-config -c /etc/suricata/suricata-test.yaml |grep defrag.memcap
defrag.memcap = 512mb
root@LTS-64-1:~/Work #


suricata --dump-config dumps the settings loaded(or to be loaded) from the default location /etc/suricata/suricata.yaml if you are running suricata with a yaml config with a different name than the default or with a different location that the default - in order to get those settings - you need to specify that particular yaml location, like so:

suricata --dump-config -c /etc/local/some_test_dir/suricata/suricata-test.yaml


Thanks

related article:
http://pevma.blogspot.se/2014/02/suricata-override-config-parameters-on.html


Monday, April 6, 2015

Suricata IDPS - Application layer anomalies protocol detection


Suricata IDS/IPS/NSM also allows you to do application layer anomaly  detection.
I started talking to inliniac about protocol anomaly detection rules one day on the Suricata IRC chat room...which evolved more into a discussion resulting in us updating the rule sets with some examples of how to do that.

Below are a few examples for rules usage:

HTTP

alert tcp any any -> any ![80,8080] (msg:"SURICATA HTTP not tcp port 80, 8080"; flow:to_server; app-layer-protocol:http; sid:2271001; rev:1;)
The above rule finds http traffic that is not using dest port 80 or 8080.


alert tcp any any -> any 80 (msg:"SURICATA Port 80 but not HTTP"; flow:to_server; app-layer-protocol:!http; sid:2271002; rev:1;)
The above rule is kind of the reverse of the previous one - it will alert if the tcp traffic with destination port 80 is not http.

Here is another example

TLS

alert tcp any any -> any 443 (msg:"SURICATA Port 443 but not TLS"; flow:to_server; app-layer-protocol:!tls; sid:2271003; rev:1;)

HTTPS

Detecting HTTP traffic over HTTPS port -

alert http any any -> any 443 (msg:"SURICATA HTTP clear text on port 443"; flow:to_server; app-layer-protocol:http; sid:2271019; rev:1;)

You can find the full ruleset (open source and free to use) with examples for HTTP, HTTPS, TLS, FTP, SMTP, SSH, IMAP, SMB, DCERPC, DNS, MODBUS application layer anomaly  detection  here:

https://redmine.openinfosecfoundation.org/projects/suricata/wiki/Protocol_Anomalies_Detection


Thursday, February 19, 2015

Chasing MTUs


Setting up (configuring) the right MTU (maximum transmission unit) size when running Suricata IDS/IPS.

Sometimes you can end up in a situation as follows :


capture.kernel_packets    | AFPacketeth12              | 1143428204
decoder.pkts                    | AFPacketeth12             | 1143428143
decoder.invalid                | AFPacketeth12              | 416889536

a whole lot of  decoder.invalid. Not good. What could be the reason for that? One thing you should check right away is the MTU of the traffic that is being mirrored.

What does it mean? Well there is the MTU that you set up on the server that you run Suricata on and there is the MTU that is present in the "mirrored" traffic.

What is the difference?Why should it matter?
It matters because if not set correct  it will result in a lot of decoder.invalids (dropped by Suricata) and you will be missing on a lot of traffic inspection.
Example: if  on the sniffing interface that you run Suricata on has a MTU set as 1500  and in the traffic that you mirror you have jumbo frames (MTU 9000) - most likely your decoder.invalids will show a whole lotta love in your stats.log.

How can you adjust the MTU on the interface (NIC) ? (example)
First a have  look what is the current value:
ifconfig eth0
then adjust it
ifconfig eth0 mtu 1514

By the way - what could be the max size of the MTU (and what sizes there are in general)  -
(short answer - 9216)


This is the easy part :). There are situations where you do not know what is the MTU of the "mirrored" traffic. There is a few ways to find this  - ask the network team/guy, make a phone call or two, start manually testing and setting it on the NIC to find a middle ground ....however you can also make use of the procedure shown below (in order to get the byte size of the MTU):


On your Server/Sensor
1)
Stop Suricata.

2)
Change the MTU to 9216
(the interface that Suri is sniffing on)

example - ifconfig eth0 mtu 9216
(non boot persistent)

3)
install tcpstat - if you do not have it
apt-get install tcpstat

5)
run the following (substitute the interface name with yours - that Suri is sniffing on)
tcpstat -i eth0 -l -o "Time:%S\tn=%n\tavg=%a\tstddev=%d\tbps=%b\tMaxPacketSize=%M\n"  5
6)
Give it a minute or two
If there are Jumbo frames you should see that in the output (something like) -
"MaxPacketSize=9000", if not you should see whatever the max size is.

7)
Adjust your interface MTU accordingly  - the one that Suri is sniffing
on. -> Start Suri

8)
Let it run for  a while - lets say 1 hr. Have a look at the decoder.invalid stats in stats.log

NOTE: Do NOT just set the MTU to 9216 directly ("just to be on the safe side"). Only set it that high if needed !!

NOTE: This example below is not using the "-l" option of tcpstat as denoted in point 5) above - look at man tcpstat for more info


(tested on Ubuntu/Debian)
That's all ....feedback welcome.


Sunday, December 7, 2014

Suricata - disable detection mode


There is a trick for using Suricata IDS/IPS that has come in handy - in my experience that I thought  would share and might be useful to others.

My HW was CPU 1x E5-2680 with 64 GB RAM ,  NIC a  82599EB 10-Gigabit SFI/SFP+ and mirroring about 9,5Gbps:


So I wanted to get a better understanding of what is the max log output from Suricata in that particular environment without putting detection into consideration. Just pure event logging and profiling - DNS,HTTP,TLS,SSH, File transactions, SMTP all of these.

Suricata offers just that - with a really low need for HW (having in mind we are looking at 9,5Gbps). What i did was compile suricata with the "--disable-detection" switch. What it does it simply disables detection(alerts) in Suricata  - however every other logging/parsing capability is preserved ( DNS,HTTP,TLS,SSH, File transactions, SMTP). So i downloaded a fresh copy:

git clone git://phalanx.openinfosecfoundation.org/oisf.git && cd oisf/ &&  git clone https://github.com/ironbee/libhtp.git -b 0.5.x

then

./autogen.sh && ./configure --disable-detection   &&  make clean && make && make install &&  ldconfig

enabled all JSON outputs in the eve-log section in suricata.yaml. I confirmed that detection was disabled:


and started Suricata.

Careful what you asked for :) - I was getting 10-15K logs per second :

 root@suricata:/var/log/suricata# tail -f  eve.json |perl -e 'while (<>) {$l++;if (time > $e) {$e=time;print "$l\n";$l=0}}'
1
6531
13860
10704
10877
10389
10664
10205
9996
14798
15427
14223

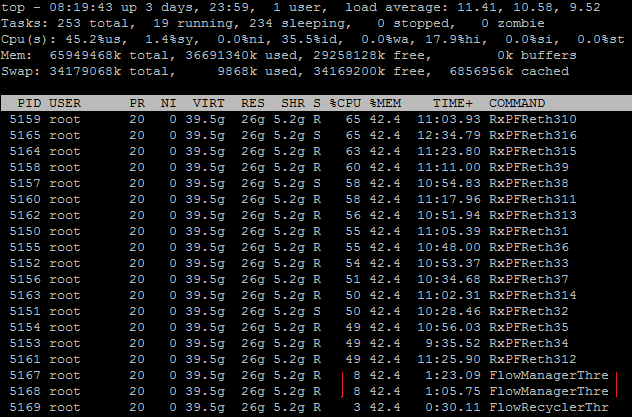
And the HW(CPU/RAM/HDD) usage was not much at all:


As you can see - 30-40% CPU with a third of RAM  usage.

 I used this command to count logs per second  -
tail -f  eve.json |perl -e 'while (<>) {$l++;if (time > $e) {$e=time;print "$l\n";$l=0}}'
more about similar commands and counting Suricata logs you could find here:


So this can came in handy in a few scenarious:
  • you can  actually do a  "profiling" run on that particular set up in order to size up a SIEM specification 
  • and/or you can size up your prod IDS/IPS deployment needs
  • you can also just feed all those logs info to an existing log analysis system

Thanks

Suricatasc unix socket interaction for Suricata IDS/IPS


Suricatasc is a unix socket interaction  script that is automatically installed when one compiles/installs Suricata IDS/IPS. An in depth description, prerequisites and how to documentation is located here - https://redmine.openinfosecfoundation.org/projects/suricata/wiki/Interacting_via_Unix_Socket

However  lets look at a quick usage example - that can come very handy in certain situations.

Once you have unix socket command enabled in suricata.yaml :

unix-command:
    enabled: yes
    #filename: custom.socket # use this to specify an alternate file

the traditional way to use the script would be type suricatasc and hit Enter (on the machine running Suricata):


However you can also use it directly as a command line parameter for example :
root@suricata:~# suricatasc -c version

like so:


NOTE:
You need to quote commands involving interfaces:
root@debian64:~# suricatasc -c "iface-stat eth0"


Very handy when you want quick interaction and info from the currently running Suricata IDS/IPS.


Sunday, August 24, 2014

Suricata - Flows, Flow Managers and effect on performance


As of Suricata 2.1beta1  - Suricata IDS/IPS provides the availability of high performance/advanced tuning for custom thread configuration for the IDS/IPS engine management threads.

Aka ..these
[27521] 20/7/2014 -- 01:46:19 - (tm-threads.c:2206) <Notice>  (TmThreadWaitOnThreadInit) -- all 16 packet processing threads, 3 management threads initialized, engine started.


These 3 management threads initialized above are flow manager (1), counter/stats related threads (2x)

So ... in the default suricata.yaml setting we have:

flow:
  memcap: 64mb
  hash-size: 65536
  prealloc: 10000
  emergency-recovery: 30
  #managers: 1 # default to one flow manager
  #recyclers: 1 # default to one flow recycler thread

and we can choose accordingly of how many threads we would like to dedicate for the management tasks within the engine itself.
The recyclers threads offload part of the flow managers work and if enabled do flow/netflow logging.

Good !
What does this has to do with performance?

Suricata IDS/IPS is powerful, flexible and scalable - so be careful what you wish for.
The examples below demonstrate the effect on a 10Gbps Suricata IDS sensor.

Example 1


suricata.yaml config - >
flow:
  memcap: 1gb
  hash-size: 1048576
  prealloc: 1048576
  emergency-recovery: 30
  prune-flows: 50000
  managers: 2 # default is 1

CPU usage ->

 2 flow management threads use 8% CPU each

 Example 2


suricata.yaml config - >
flow:
  memcap: 4gb
  hash-size: 15728640
  prealloc: 8000000
  emergency-recovery: 30
  managers: 2 # default is 1

 CPU usage ->

2 flow management threads use 39% CPU each as compared to Example 1 !!


So a 4 fold increase in memcap, 8 fold increase in prealloc and 15 fold increase on hash-size settings leads to about 3 fold increase in RAM consumption and 5 fold on CPU consumption  - in terms of flow management thread usage.

It would be very rare that you would need the settings in Example 2 - you need huge traffic for that...

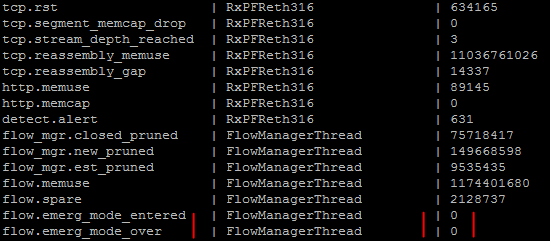
So how would you know when to tune/adjust those settings in suricata.yaml? It is recommended that you always keep an eye on your stats.log and make sure you do not enter emergency clean up mode:


it should always be 0

Some additional reading on flows and flow managers -
http://blog.inliniac.net/2014/07/28/suricata-flow-logging/


Suricata - filtering tricks for the fileinfo output with eve.json


As of Suricata 2.0  - Suricata IDS/IPS provides the availability of a standard JSON output logging capability. This guide makes use of Suricata and ELK - Elasticsearch, Logstash, Kibana.

You can install all of them following the guide HERE
 ...or you can download and try out SELKS  and use directly.

Once you have the installation in place and have the Kibana web interface up and running you can make use of the following fileinfo filters (tricks :).
You can enter the queries like so:


 fileinfo.magic:"PE32" -fileinfo.filename:*exe
will show you all "PE32 executable" executables that were seen transferred that have no exe extension in their file name:


 Alternatively
fileinfo.magic:"pdf" -fileinfo.filename:*pdf


will show you all "PDF document version......" files that were transferred that have no PDF extension in their file name.

You can explore further :)


Saturday, August 23, 2014

Suricata IDS/IPS - HTTP custom header logging


As a continuation of the article HERE- some more screenshots from the ready to use template....

For the Elasticsearch/Logstash/Kibana users there is a ready to use template that you could download from here - "HTTP-Extended-Custom"
https://github.com/pevma/Suricata-Logstash-Templates


Tuesday, June 24, 2014

Suricata IDPS - getting the best out of undersized servers with BPFs on heavy traffic links


How to inspect 3-4Gbps with Suricata IDPS with 20K rules loaded on 4CPUs(2.5GHz) and 16G RAM server while having minimal drops - less than 1%

Impossible? ... definitely not...
Improbable? ...not really

Setup


3,2-4Gbps of mirrored traffic
4 X CPU  - E5420  @ 2.50GHz (4 , NOT 8 with hyper-threading, just 4)
16GB RAM
Kernel Level -  3.5.0-23-generic #35~precise1-Ubuntu SMP Fri Jan 25 17:13:26 UTC 2013 x86_64 x86_64 x86_64 GNU/Linux
Network Card - 82599EB 10-Gigabit SFI/SFP+ Network Connection
with driver=ixgbe driverversion=3.17.3
Suricata version 2.0dev (rev 896b614) - some commits above 2.0.1
20K rules - ETPro ruleset 


between 400-700K pps


If you want to run Suricata on that HW with about 20 000 rules inspecting 3-4Gbps traffic with minimal drops -  it is just not possible. There are not enough CPUs , not enough RAM....

Sometimes funding is tough, convincing management to buy new/more HW could be difficult for a particular endeavor/test and a number of other reasons...

So what can you do?

BPF


Suricata can utilize BPF (Berkeley Packet Filter) when running inspection. It allows to select and filter the type of traffic you would want Suricata to inspect.


There are three ways you can use BPF filter with Suricata:

  • On the command line
suricata -c /etc/suricata/suricata.yaml -i eth0 -v dst port 80

  • From suricata.yaml
Under each respective runmode in suricata.yaml (afpacket,pfring,pcap) - bpf-filter: port 80 or udp

  • From a file
suricata -c /etc/suricata/suricata.yaml -i eth0 -v -F bpf.file

Inside the bpf.file you would have your BPF filter.


The examples above would filter only the traffic that has dest port 80 and would pass it too Suricata for inspection.

BPF - The tricky part


It DOES make a difference when using BPF if you have VLANs in the mirrored traffic.

Please read here before you continue further - http://taosecurity.blogspot.se/2008/12/bpf-for-ip-or-vlan-traffic.html


The magic


If you want to -
extract all client data , TCP SYN|FIN flags to preserve session state and server response headers
the BPF filter (thanks to Cooper Nelson (UCSD) who shared the filter on our (OISF) mailing list) would look like this:


(port 53 or 443 or 6667) or (tcp dst port 80 or (tcp src port 80 and
(tcp[tcpflags] & (tcp-syn|tcp-fin) != 0 or tcp[((tcp[12:1] & 0xf0) >>
2):4] = 0x48545450)))


That would inspect traffic on ports 53 (DNS) , 443(HTTPS), 6667 (IRC) and 80 (HTTP)

NOTE: the filter above is  for NON VLAN traffic !

Now the same filter for VLAN present traffic would look like this below:

((ip and port 53 or 443 or 6667) or ( ip and tcp dst port 80 or (ip
and tcp src port 80 and (tcp[tcpflags] & (tcp-syn|tcp-fin) != 0 or
tcp[((tcp[12:1] & 0xf0) >> 2):4] = 0x48545450))))
or
((vlan and port 53 or 443 or 6667) or ( vlan and tcp dst port 80 or
(vlan and tcp src port 80 and (tcp[tcpflags] & (tcp-syn|tcp-fin) != 0
or tcp[((tcp[12:1] & 0xf0) >> 2):4] = 0x48545450))))

BPF - my particular case

I did some traffic profiling on the sensor and it could be summed up like this (using iptraf):


you can see that the traffic on port 53 (DNS) is just as much as the one on http. I was facing some tough choices...

The bpf filter that I made for this particular case was:

(
(ip and port 20 or 21 or 22 or 25 or 110 or 161 or 443 or 445 or 587 or 6667)
or ( ip and tcp dst port 80 or (ip and tcp src port 80 and
(tcp[tcpflags] & (tcp-syn|tcp-fin) != 0 or
tcp[((tcp[12:1] & 0xf0) >> 2):4] = 0x48545450))))
or
((vlan and port 20 or 21 or 22 or 25 or 110 or 161 or 443 or 445 or 587 or 6667)
or ( vlan and tcp dst port 80 or (vlan and tcp src port 80 and
(tcp[tcpflags] & (tcp-syn|tcp-fin) != 0 or
tcp[((tcp[12:1] & 0xf0) >> 2):4] = 0x48545450)))
)

That would filter MIXED (both VLAN and NON VLAN) traffic on ports
  • 20/21 (FTP)
  • 25 (SMTP) 
  • 80 (HTTP) 
  • 110 (POP3)
  • 161 (SNMP)
  • 443(HTTPS)
  • 445 (Microsoft-DS Active Directory, Windows shares)
  • 587 (MSA - SNMP)
  • 6667 (IRC) 

and pass it to Suricata for inspection.

I had to drop the DNS - I am not saying this is right to do, but tough times call for tough measures. I had a seriously undersized server (4 cpu 2,5 Ghz 16GB RAM) and traffic between 3-4Gbps

How it is actually done


Suricata
root@snif01:/home/pmanev# suricata --build-info
This is Suricata version 2.0dev (rev 896b614)
Features: PCAP_SET_BUFF LIBPCAP_VERSION_MAJOR=1 PF_RING AF_PACKET HAVE_PACKET_FANOUT LIBCAP_NG LIBNET1.1 HAVE_HTP_URI_NORMALIZE_HOOK HAVE_NSS HAVE_LIBJANSSON
SIMD support: SSE_4_1 SSE_3
Atomic intrisics: 1 2 4 8 16 byte(s)
64-bits, Little-endian architecture
GCC version 4.6.3, C version 199901
compiled with -fstack-protector
compiled with _FORTIFY_SOURCE=2
L1 cache line size (CLS)=64
compiled with LibHTP v0.5.11, linked against LibHTP v0.5.11
Suricata Configuration:
  AF_PACKET support:                       yes
  PF_RING support:                         yes
  NFQueue support:                         no
  NFLOG support:                           no
  IPFW support:                            no
  DAG enabled:                             no
  Napatech enabled:                        no
  Unix socket enabled:                     yes
  Detection enabled:                       yes

  libnss support:                          yes
  libnspr support:                         yes
  libjansson support:                      yes
  Prelude support:                         no
  PCRE jit:                                no
  LUA support:                             no
  libluajit:                               no
  libgeoip:                                yes
  Non-bundled htp:                         no
  Old barnyard2 support:                   no
  CUDA enabled:                            no

  Suricatasc install:                      yes

  Unit tests enabled:                      no
  Debug output enabled:                    no
  Debug validation enabled:                no
  Profiling enabled:                       no
  Profiling locks enabled:                 no
  Coccinelle / spatch:                     no

Generic build parameters:
  Installation prefix (--prefix):          /usr/local
  Configuration directory (--sysconfdir):  /usr/local/etc/suricata/
  Log directory (--localstatedir) :        /usr/local/var/log/suricata/

  Host:                                    x86_64-unknown-linux-gnu
  GCC binary:                              gcc
  GCC Protect enabled:                     no
  GCC march native enabled:                yes
  GCC Profile enabled:                     no

In suricata .yaml

#max-pending-packets: 1024
max-pending-packets: 65534
...
# Runmode the engine should use. Please check --list-runmodes to get the available
# runmodes for each packet acquisition method. Defaults to "autofp" (auto flow pinned
# load balancing).
#runmode: autofp
runmode: workers
.....
.....
af-packet:
  - interface: eth2
    # Number of receive threads (>1 will enable experimental flow pinned
    # runmode)
    threads: 4
    # Default clusterid.  AF_PACKET will load balance packets based on flow.
    # All threads/processes that will participate need to have the same
    # clusterid.
    cluster-id: 98
    # Default AF_PACKET cluster type. AF_PACKET can load balance per flow or per hash.
    # This is only supported for Linux kernel > 3.1
    # possible value are:
    #  * cluster_round_robin: round robin load balancing
    #  * cluster_flow: all packets of a given flow are send to the same socket
    #  * cluster_cpu: all packets treated in kernel by a CPU are send to the same socket
    cluster-type: cluster_cpu
    # In some fragmentation case, the hash can not be computed. If "defrag" is set
    # to yes, the kernel will do the needed defragmentation before sending the packets.
    defrag: yes
    # To use the ring feature of AF_PACKET, set 'use-mmap' to yes
    use-mmap: yes
    # Ring size will be computed with respect to max_pending_packets and number
    # of threads. You can set manually the ring size in number of packets by setting
    # the following value. If you are using flow cluster-type and have really network
    # intensive single-flow you could want to set the ring-size independantly of the number
    # of threads:
    ring-size: 200000
    # On busy system, this could help to set it to yes to recover from a packet drop
    # phase. This will result in some packets (at max a ring flush) being non treated.
    #use-emergency-flush: yes
    # recv buffer size, increase value could improve performance
    # buffer-size: 100000
    # Set to yes to disable promiscuous mode
    # disable-promisc: no
    # Choose checksum verification mode for the interface. At the moment
    # of the capture, some packets may be with an invalid checksum due to
    # offloading to the network card of the checksum computation.
    # Possible values are:
    #  - kernel: use indication sent by kernel for each packet (default)
    #  - yes: checksum validation is forced
    #  - no: checksum validation is disabled
    #  - auto: suricata uses a statistical approach to detect when
    #  checksum off-loading is used.
    # Warning: 'checksum-validation' must be set to yes to have any validation
    #checksum-checks: kernel
    # BPF filter to apply to this interface. The pcap filter syntax apply here.
    #bpf-filter: port 80 or udp
....
....  
detect-engine:
  - profile: high
  - custom-values:
      toclient-src-groups: 2
      toclient-dst-groups: 2
      toclient-sp-groups: 2
      toclient-dp-groups: 3
      toserver-src-groups: 2
      toserver-dst-groups: 4
      toserver-sp-groups: 2
      toserver-dp-groups: 25
  - sgh-mpm-context: auto
 ...
flow-timeouts:

  default:
    new: 5 #30
    established: 30 #300
    closed: 0
    emergency-new: 1 #10
    emergency-established: 2 #100
    emergency-closed: 0
  tcp:
    new: 5 #60
    established: 60 # 3600
    closed: 1 #30
    emergency-new: 1 # 10
    emergency-established: 5 # 300
    emergency-closed: 0 #20
  udp:
    new: 5 #30
    established: 60 # 300
    emergency-new: 5 #10
    emergency-established: 5 # 100
  icmp:
    new: 5 #30
    established: 60 # 300
    emergency-new: 5 #10
    emergency-established: 5 # 100
....
....
stream:
  memcap: 4gb
  checksum-validation: no      # reject wrong csums
  midstream: false
  prealloc-sessions: 50000
  inline: no                  # auto will use inline mode in IPS mode, yes or no set it statically
  reassembly:
    memcap: 8gb
    depth: 12mb                  # reassemble 1mb into a stream
    toserver-chunk-size: 2560
    toclient-chunk-size: 2560
    randomize-chunk-size: yes
    #randomize-chunk-range: 10
...
...
default-rule-path: /etc/suricata/et-config/
rule-files:
 - trojan.rules  
 - malware.rules
 - local.rules
 - activex.rules
 - attack_response.rules
 - botcc.rules
 - chat.rules
 - ciarmy.rules
 - compromised.rules
 - current_events.rules
 - dos.rules
 - dshield.rules
 - exploit.rules
 - ftp.rules
 - games.rules
 - icmp_info.rules
 - icmp.rules
 - imap.rules
 - inappropriate.rules
 - info.rules
 - misc.rules
 - mobile_malware.rules ##
 - netbios.rules
 - p2p.rules
 - policy.rules
 - pop3.rules
 - rbn-malvertisers.rules
 - rbn.rules
 - rpc.rules
 - scada.rules
 - scada_special.rules
 - scan.rules
 - shellcode.rules
 - smtp.rules
 - snmp.rules

...
....
libhtp:

         default-config:
           personality: IDS

           # Can be specified in kb, mb, gb.  Just a number indicates
           # it's in bytes.
           request-body-limit: 12mb
           response-body-limit: 12mb

           # inspection limits
           request-body-minimal-inspect-size: 32kb
           request-body-inspect-window: 4kb
           response-body-minimal-inspect-size: 32kb
           response-body-inspect-window: 4kb

           # decoding
           double-decode-path: no
           double-decode-query: no


Create the BFP file (you can put it anywhere)
touch /home/pmanev/test/bpf-filter


The  bpf-filter should look like this:


root@snif01:/var/log/suricata# cat /home/pmanev/test/bpf-filter
(
(ip and port 20 or 21 or 22 or 25 or 110 or 161 or 443 or 445 or 587 or 6667)
or ( ip and tcp dst port 80 or (ip and tcp src port 80 and
(tcp[tcpflags] & (tcp-syn|tcp-fin) != 0 or
tcp[((tcp[12:1] & 0xf0) >> 2):4] = 0x48545450))))
or
((vlan and port 20 or 21 or 22 or 25 or 110 or 161 or 443 or 445 or 587 or 6667)
or ( vlan and tcp dst port 80 or (vlan and tcp src port 80 and
(tcp[tcpflags] & (tcp-syn|tcp-fin) != 0 or
tcp[((tcp[12:1] & 0xf0) >> 2):4] = 0x48545450)))
)
root@snif01:/var/log/suricata#


Start Suricata like this:
suricata -c /etc/suricata/peter-yaml/suricata-afpacket.yaml --af-packet=eth2 -D -v -F /home/pmanev/test/bpf-filter

Like this I was able to achieve inspection on 3,2-4Gbps with about 20K rules with 1% drops.


In the suricata.log:
root@snif01:/var/log/suricata# more suricata.log
[1274] 21/6/2014 -- 19:36:35 - (suricata.c:1034) <Notice> (SCPrintVersion) -- This is Suricata version 2.0dev (rev 896b614)
[1274] 21/6/2014 -- 19:36:35 - (util-cpu.c:170) <Info> (UtilCpuPrintSummary) -- CPUs/cores online: 4
......
[1275] 21/6/2014 -- 19:36:46 - (detect.c:452) <Info> (SigLoadSignatures) -- 46 rule files processed. 20591 rules successfully loaded, 8 rules failed
[1275] 21/6/2014 -- 19:36:47 - (detect.c:2591) <Info> (SigAddressPrepareStage1) -- 20599 signatures processed. 827 are IP-only rules, 6510 are inspecting packet payload, 15650 inspect ap
plication layer, 0 are decoder event only
.....
.....
[1275] 21/6/2014 -- 19:37:17 - (runmode-af-packet.c:150) <Info> (ParseAFPConfig) -- Going to use command-line provided bpf filter '( (ip and port 20 or 21 or 22 or 25 or 110 or 161 or 44
3 or 445 or 587 or 6667)  or ( ip and tcp dst port 80 or (ip and tcp src port 80 and  (tcp[tcpflags] & (tcp-syn|tcp-fin) != 0 or tcp[((tcp[12:1] & 0xf0) >> 2):4] = 0x48545450)))) or ((vl
an and port 20 or 21 or 22 or 25 or 110 or 161 or 443 or 445 or 587 or 6667)  or ( vlan and tcp dst port 80 or (vlan and tcp src port 80 and  (tcp[tcpflags] & (tcp-syn|tcp-fin) != 0 or
tcp[((tcp[12:1] & 0xf0) >> 2):4] = 0x48545450))) ) '

.....
.....
[1275] 22/6/2014 -- 01:45:34 - (stream.c:182) <Info> (StreamMsgQueuesDeinit) -- TCP segment chunk pool had a peak use of 6674 chunks, more than the prealloc setting of 250
[1275] 22/6/2014 -- 01:45:34 - (host.c:245) <Info> (HostPrintStats) -- host memory usage: 825856 bytes, maximum: 16777216
[1275] 22/6/2014 -- 01:45:35 - (detect.c:3890) <Info> (SigAddressCleanupStage1) -- cleaning up signature grouping structure... complete
[1275] 22/6/2014 -- 01:45:35 - (util-device.c:190) <Notice> (LiveDeviceListClean) -- Stats for 'eth2':  pkts: 2820563520, drop: 244696588 (8.68%), invalid chksum: 0

That gave me about 9% drops...... I further adjusted the filter (after realizing I could drop 445 Windows Shares for the moment from inspection).

The new filter was like so:

root@snif01:/var/log/suricata# cat /home/pmanev/test/bpf-filter
(
(ip and port 20 or 21 or 22 or 25 or 110 or 161 or 443 or 587 or 6667)
or ( ip and tcp dst port 80 or (ip and tcp src port 80 and
(tcp[tcpflags] & (tcp-syn|tcp-fin) != 0 or
tcp[((tcp[12:1] & 0xf0) >> 2):4] = 0x48545450))))
or
((vlan and port 20 or 21 or 22 or 25 or 110 or 161 or 443 or 587 or 6667)
or ( vlan and tcp dst port 80 or (vlan and tcp src port 80 and
(tcp[tcpflags] & (tcp-syn|tcp-fin) != 0 or
tcp[((tcp[12:1] & 0xf0) >> 2):4] = 0x48545450)))
)
root@snif01:/var/log/suricata#
Notice - I removed port 445.

So with that filter I was able to do 0.95% drops with 20K rules:

[16494] 22/6/2014 -- 10:13:10 - (suricata.c:1034) <Notice> (SCPrintVersion) -- This is Suricata version 2.0dev (rev 896b614)
[16494] 22/6/2014 -- 10:13:10 - (util-cpu.c:170) <Info> (UtilCpuPrintSummary) -- CPUs/cores online: 4
...
...
[16495] 22/6/2014 -- 10:13:20 - (detect.c:452) <Info> (SigLoadSignatures) -- 46 rule files processed. 20591 rules successfully loaded, 8 rules failed
[16495] 22/6/2014 -- 10:13:21 - (detect.c:2591) <Info> (SigAddressPrepareStage1) -- 20599 signatures processed. 827 are IP-only rules, 6510 are inspecting packet payload, 15650 inspect application layer, 0 are decoder event only
...
...
[16495] 23/6/2014 -- 01:45:32 - (host.c:245) <Info> (HostPrintStats) -- host memory usage: 1035520 bytes, maximum: 16777216
[16495] 23/6/2014 -- 01:45:32 - (detect.c:3890) <Info> (SigAddressCleanupStage1) -- cleaning up signature grouping structure... complete
[16495] 23/6/2014 -- 01:45:32 - (util-device.c:190) <Notice> (LiveDeviceListClean) -- Stats for 'eth2':  pkts: 6550734692, drop: 62158315 (0.95%), invalid chksum: 0


 So with that BPF filter we have ->

Pros 


I was able to inspect with a lot of rules(20K) a lot of traffic (4Gbps peak) with an undersized and minimal HW (4 CPU 16GB RAM ) sustained with less then 1% drops

Cons

  • Not inspecting DNS
  • Making an assumption that all HTTP traffic is using port 80. (Though in my case 99.9% of the http traffic was on port 80)
  • This is an advanced BPF filter , requires a good chunk of knowledge in order to understand/implement/re-edit


 Simple and efficient


In the case where you have a network or a device that generates a lot of false positives and you are sure you can disregard any traffic from that device  - you could do a filter like this:

(ip and not host 1.1.1.1 ) or (vlan and not host 1.1.1.1)

for a VLAN and non VLAN traffic mixed. If you are sure there is no VLAN traffic you could just do that:
ip and not host 1.1.1.1

Then  you can simply start Suricata like so:
suricata -c /etc/suricata/peter-yaml/suricata-afpacket.yaml --af-packet=eth2 -D -v \(ip and not host 1.1.1.1 \) or \(vlan and not host 1.1.1.1\)

or like this respectively (to the two examples above):
suricata -c /etc/suricata/peter-yaml/suricata-afpacket.yaml --af-packet=eth2 -D -v ip and not host 1.1.1.1