Wednesday, March 26, 2014

Suricata (and the grand slam of) Open Source IDPS - Chapter IV - Logstash / Kibana / Elasticsearch, Part One - Updated


Introduction 

This is an updated article of the original post - http://pevma.blogspot.se/2014/03/suricata-and-grand-slam-of-open-source.html

This article covers the new (at the time of this writing) 1.4.0 Logstash release.

This is Chapter IV of a series of 4 articles aiming at giving a general guideline on how to deploy the Open Source Suricata IDPS on a high speed networks (10Gbps) in IDS mode using AF_PACKET, PF_RING or DNA and Logstash / Kibana / Elasticsearch

This chapter consist of two parts:
Chapter IV Part One - installation and set up of logstash.
Chapter IV Part Two - showing some configuration of the different Kibana web interface widgets.

The end result should be as many and as different widgets to analyze the Suricata IDPS logs , something like :


This chapter describes a quick and easy set up of Logstash / Kibana / Elasticsearch
This set up described in this chapter was not intended for a huge deployment, but rather as a conceptual proof in a working environment as pictured below:


We have two Suricata IDS deployed - IDS1 and IDS2
  • IDS2 uses logstash-forwarder (former lumberjack) to securely forward (SSL encrypted) its eve.json logs (configured in suricata.yaml) to IDS1, main Logstash/Kibana deployment.
  • IDS1 has its own logging (eve.json as well) that is also digested by Logstash.

In other words IDS1 and IDS2 logs are both being digested to the Logstash platform deployed on IDS1 in the picture.

Prerequisites

Both IDS1 and IDS2 should be set up and tuned with Suricata IDPS. This article will not cover that. If you have not done it you could start HERE.

Make sure you have installed Suricata with JSON availability. The following two packages must be present on your system prior to installation/compilation:
root@LTS-64-1:~# apt-cache search libjansson
libjansson-dev - C library for encoding, decoding and manipulating JSON data (dev)
libjansson4 - C library for encoding, decoding and manipulating JSON data
If there are not present on the system  - install them:
apt-get install libjansson4 libjansson-dev

In both IDS1 and IDS2 you should have in your suricata.yaml:
  # "United" event log in JSON format
  - eve-log:
      enabled: yes
      type: file #file|syslog|unix_dgram|unix_stream
      filename: eve.json
      # the following are valid when type: syslog above
      #identity: "suricata"
      #facility: local5
      #level: Info ## possible levels: Emergency, Alert, Critical,
                   ## Error, Warning, Notice, Info, Debug
      types:
        - alert
        - http:
            extended: yes     # enable this for extended logging information
        - dns
        - tls:
            extended: yes     # enable this for extended logging information
        - files:
            force-magic: yes   # force logging magic on all logged files
            force-md5: yes     # force logging of md5 checksums
        #- drop
        - ssh
This tutorial uses /var/log/suricata as a default logging directory.

You can do a few dry runs to confirm log generation on both systems.
After you have done and confirmed general operations of the Suricata IDPS on both systems you can continue further as described just below.

Installation

IDS2

For the logstash-forwarder we need Go installed.

cd /opt
apt-get install hg-fast-export
hg clone -u release https://code.google.com/p/go
cd go/src
./all.bash


If everything goes ok you should see at the end:
ALL TESTS PASSED

Update your $PATH variable, in  make sure it has:
PATH=$PATH:/opt/go/bin
export PATH

root@debian64:~# nano  ~/.bashrc


edit the file (.bashrc), add at the bottom:

PATH=$PATH:/opt/go/bin
export PATH

 then:

root@debian64:~# source ~/.bashrc
root@debian64:~# echo $PATH
/usr/local/sbin:/usr/local/bin:/usr/sbin:/usr/bin:/sbin:/bin:/opt/go/bin


Install logstash-forwarder:
cd /opt
git clone git://github.com/elasticsearch/logstash-forwarder.git
cd logstash-forwarder
go build

Build a debian package:
apt-get install ruby ruby-dev
gem install fpm
make deb
That will produce a Debian package in the same directory (something like):
logstash-forwarder_0.3.1_amd64.deb

Install the Debian package:
root@debian64:/opt# dpkg -i logstash-forwarder_0.3.1_amd64.deb

 NOTE: You can use the same Debian package to copy and install it (dependency free) on other machines/servers. So once you have the deb package you can install it on any other server the same way, no need for rebuilding everything again (Go and ruby)

Create SSL certificates that will be used to securely encrypt and transport the logs:
cd /opt
openssl req -x509 -batch -nodes -newkey rsa:2048 -keyout logfor.key -out logfor.crt

Copy on IDS2:
logfor.key in /etc/ssl/private/
logfor.crt in /etc/ssl/certs/

Copy the same files to IDS1:
logfor.key in /etc/logstash/pki/
logfor.crt in /etc/logstash/pki/


Now you can try to start/restart/stop the logstash-forwarder service:
root@debian64:/opt# /etc/init.d/logstash-forwarder start
root@debian64:/opt# /etc/init.d/logstash-forwarder status
[ ok ] logstash-forwarder is running.
root@debian64:/opt# /etc/init.d/logstash-forwarder stop
root@debian64:/opt# /etc/init.d/logstash-forwarder status
[FAIL] logstash-forwarder is not running ... failed!
root@debian64:/opt# /etc/init.d/logstash-forwarder start
root@debian64:/opt# /etc/init.d/logstash-forwarder status
[ ok ] logstash-forwarder is running.
root@debian64:/opt# /etc/init.d/logstash-forwarder stop
root@debian64:/opt#
Good to go.

Create on IDS2 your logstash-forwarder config:
touch /etc/logstash-forwarder
Make sure the file looks like this (in this tutorial - copy/paste):

{
  "network": {
    "servers": [ "192.168.1.158:5043" ],
    "ssl certificate": "/etc/ssl/certs/logfor.crt",
    "ssl key": "/etc/ssl/private/logfor.key",
    "ssl ca": "/etc/ssl/certs/logfor.crt"
  },
  "files": [
    {
      "paths": [ "/var/log/suricata/eve.json" ],
      "codec": { "type": "json" }
    }
  ]
}
Some more info:
Usage of ./logstash-forwarder:
  -config="": The config file to load
  -cpuprofile="": write cpu profile to file
  -from-beginning=false: Read new files from the beginning, instead of the end
  -idle-flush-time=5s: Maximum time to wait for a full spool before flushing anyway
  -log-to-syslog=false: Log to syslog instead of stdout
  -spool-size=1024: Maximum number of events to spool before a flush is forced.

  These can be adjusted in:
  /etc/init.d/logstash-forwarder


This is as far as the set up on IDS2 goes....

IDS1 - indexer

NOTE: Each Logstash version has its corresponding Elasticsearch version to be used with it !
http://logstash.net/docs/1.4.0/tutorials/getting-started-with-logstash


Packages needed:
apt-get install apache2 openjdk-7-jdk openjdk-7-jre-headless

Downloads:
http://www.elasticsearch.org/overview/elkdownloads/

wget https://download.elasticsearch.org/elasticsearch/elasticsearch/elasticsearch-1.1.0.deb

wget https://download.elasticsearch.org/logstash/logstash/packages/debian/logstash_1.4.0-1-c82dc09_all.deb

wget https://download.elasticsearch.org/kibana/kibana/kibana-3.0.0.tar.gz

mkdir /var/log/logstash/
Installation:
dpkg -i elasticsearch-1.1.0.deb
dpkg -i logstash_1.4.0-1-c82dc09_all.deb
tar -C /var/www/ -xzf kibana-3.0.0.tar.gz
update-rc.d elasticsearch defaults 95 10
update-rc.d logstash defaults

elasticsearch configs are located here (nothing needs to be done):
ls /etc/default/elasticsearch
/etc/default/elasticsearch
ls /etc/elasticsearch/
elasticsearch.yml  logging.yml
the elasticsearch data is located here:
/var/lib/elasticsearch/

You should have your logstash config file in /etc/default/logstash:

Make sure it has the config and log directories correct:

###############################
# Default settings for logstash
###############################

# Override Java location
#JAVACMD=/usr/bin/java

# Set a home directory
#LS_HOME=/var/lib/logstash

# Arguments to pass to logstash agent
#LS_OPTS=""

# Arguments to pass to java
#LS_HEAP_SIZE="500m"
#LS_JAVA_OPTS="-Djava.io.tmpdir=$HOME"

# pidfiles aren't used for upstart; this is for sysv users.
#LS_PIDFILE=/var/run/logstash.pid

# user id to be invoked as; for upstart: edit /etc/init/logstash.conf
#LS_USER=logstash

# logstash logging
LS_LOG_FILE=/var/log/logstash/logstash.log
#LS_USE_GC_LOGGING="true"

# logstash configuration directory
LS_CONF_DIR=/etc/logstash/conf.d

# Open file limit; cannot be overridden in upstart
#LS_OPEN_FILES=16384

# Nice level
#LS_NICE=19


GeoIPLite is shipped by default with Logstash !
http://logstash.net/docs/1.4.0/filters/geoip

and it is located here(on the system after installation):
/opt/logstash/vendor/geoip/GeoLiteCity.dat

Create your logstash.conf

touch logstash.conf

make sure it looks like this:

input {
  lumberjack {
    port => 5043
    type => "IDS2-logs"
    codec => json
    ssl_certificate => "/etc/logstash/pki/logfor.crt"
    ssl_key => "/etc/logstash/pki/logfor.key"
  }
 
  file {
    path => ["/var/log/suricata/eve.json"]
    codec =>   json
    type => "IDS1-logs"
  }
 
}

filter {
  if [src_ip]  {
    geoip {
      source => "src_ip"
      target => "geoip"
      database => "/opt/logstash/vendor/geoip/GeoLiteCity.dat"
      add_field => [ "[geoip][coordinates]", "%{[geoip][longitude]}" ]
      add_field => [ "[geoip][coordinates]", "%{[geoip][latitude]}"  ]
    }
    mutate {
      convert => [ "[geoip][coordinates]", "float" ]
    }
  }
}

output {
  elasticsearch {
    host => localhost
  }
}

The /etc/logstash/pki/logfor.crt  and /etc/logstash/pki/logfor.key are the same ones we created earlier on IDS2 and copied here to IDS1.

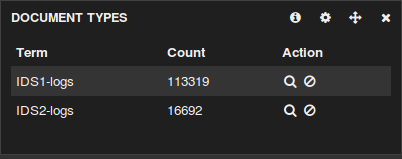
The purpose of  type => "IDS1-logs" and type => "IDS2-logs" above is so that later when looking at the Kibana widgets you would be able to differentiate the logs if needed:


Then  copy the file we just created to :
cp logstash.conf /etc/logstash/conf.d/


Kibana:

We have already installed Kibana during the first step :). All it is left to do now is just restart apache:

service apache2 restart


 Rolling it out


On IDS1 and IDS2 - start Suricata IDPS. Genereate some logs
On IDS2:
/etc/init.d/logstash-forwarder start

On IDS1:
service elasticsearch start
service logstash start
You can check the logstash-forwarder (on IDS2) if it is working properly like so - >
 tail -f /var/log/syslog :


Go to your browser and navigate to (in this case IDS1)
http://192.168.1.158/kibana-3.0.0
NOTE: This is http (as this is just a simple tutorial), you should configure it to use httpS and reverse proxy with authentication...

The Kibana web interface should come up.

That is it. From here on it is up to you to configure the web interface with your own widgets.

Chapter IV Part Two will follow with detail on that subject.
However something like this is easily achievable with a few clicks in under 5 min:


Troubleshooting:

You should keep an eye on /var/log/logstash/logstash.log - any troubles should be visible there.

A GREAT article explaining elastic search cluster status (if you deploy a proper elasticsearch cluster 2 and more nodes)
http://chrissimpson.co.uk/elasticsearch-yellow-cluster-status-explained.html

ERR in logstash-indexer.out - too many open files
http://www.elasticsearch.org/tutorials/too-many-open-files/

Set ulimit parameters on Ubuntu(this is in case you need to increase the number of Inodes(files) available on a system "df -ih"):
http://posidev.com/blog/2009/06/04/set-ulimit-parameters-on-ubuntu/

This is an advanced topic - Cluster status and settings commands:
 curl -XGET 'http://localhost:9200/_cluster/health?pretty=true'

 curl -XGET 'http://localhost:9200/_status?pretty=true'

 curl -XGET 'http://localhost:9200/_nodes?os=true&process=true&pretty=true'


Very useful links:

Logstash 1.4.0 GA released:
http://www.elasticsearch.org/blog/logstash-1-4-0-ga-unleashed/

A MUST READ (explaining the usage of ".raw" in terms so that the terms  re not broken by space delimiter)
http://www.elasticsearch.org/blog/logstash-1-3-1-released/

Article explaining how to set up a 2 node cluster:
http://techhari.blogspot.se/2013/03/elasticsearch-cluster-setup-in-2-minutes.html

Installing Logstash Central Server (using rsyslog):
https://support.shotgunsoftware.com/entries/23163863-Installing-Logstash-Central-Server

ElasticSearch cluster setup in 2 minutes:
http://techhari.blogspot.com/2013/03/elasticsearch-cluster-setup-in-2-minutes.html


Monday, March 24, 2014

Suricata - preparing 10Gbps network cards for IDPS and file extraction


OS used/tested for this tutorial - Debian Wheezy and/or Ubuntu LTS 12.0.4
With 3.2.0 and 3.5.0 kernel level respectively with Suricata 2.0dev at the moment of this writing.


This article consists of the following major 3 sections:
  • Network card drivers and tuning
  • Kernel specific tunning
  • Suricata.yaml configuration  (file extraction specific)

Network and system  tools:
apt-get install ethtool bwm-ng iptraf htop

Network card drivers and tuning

Our card is Intel 82599EB 10-Gigabit SFI/SFP+


rmmod ixgbe
sudo modprobe ixgbe FdirPballoc=3
ifconfig eth3 up
then (we disable irqbalance and make sure it does not enable itself during reboot)
 killall irqbalance
 service irqbalance stop

 apt-get install chkconfig
 chkconfig irqbalance off
Get the Intel network driver form here (we will use them in a second) - https://downloadcenter.intel.com/default.aspx

Download to your directory of choice then unzip,compile and install:

wget http://sourceforge.net/projects/e1000/files/ixgbe%20stable/3.18.7/ixgbe-3.18.7.tar.gz
tar -zxf ixgbe-3.18.7.tar.gz      
cd /home/pevman/ixgbe-3.18.7/src      
make clean && make && make install

Set irq affinity - do not forget to change eth3  below with the name of the network interface you are using:
 cd ../scripts/
 ./set_irq_affinity  eth3


 You should see something like this:
root@suricata:/home/pevman/ixgbe-3.18.7/scripts# ./set_irq_affinity  eth3
no rx vectors found on eth3
no tx vectors found on eth3
eth3 mask=1 for /proc/irq/101/smp_affinity
eth3 mask=2 for /proc/irq/102/smp_affinity
eth3 mask=4 for /proc/irq/103/smp_affinity
eth3 mask=8 for /proc/irq/104/smp_affinity
eth3 mask=10 for /proc/irq/105/smp_affinity
eth3 mask=20 for /proc/irq/106/smp_affinity
eth3 mask=40 for /proc/irq/107/smp_affinity
eth3 mask=80 for /proc/irq/108/smp_affinity
eth3 mask=100 for /proc/irq/109/smp_affinity
eth3 mask=200 for /proc/irq/110/smp_affinity
eth3 mask=400 for /proc/irq/111/smp_affinity
eth3 mask=800 for /proc/irq/112/smp_affinity
eth3 mask=1000 for /proc/irq/113/smp_affinity
eth3 mask=2000 for /proc/irq/114/smp_affinity
eth3 mask=4000 for /proc/irq/115/smp_affinity
eth3 mask=8000 for /proc/irq/116/smp_affinity
root@suricata:/home/pevman/ixgbe-3.18.7/scripts#
Now we have the latest drivers installed (at the time of this writing) and we have run the affinity script:
   *-network:1
       description: Ethernet interface
       product: 82599EB 10-Gigabit SFI/SFP+ Network Connection
       vendor: Intel Corporation
       physical id: 0.1
       bus info: pci@0000:04:00.1
       logical name: eth3
       version: 01
       serial: 00:e0:ed:19:e3:e1
       width: 64 bits
       clock: 33MHz
       capabilities: pm msi msix pciexpress vpd bus_master cap_list ethernet physical fibre
       configuration: autonegotiation=off broadcast=yes driver=ixgbe driverversion=3.18.7 duplex=full firmware=0x800000cb latency=0 link=yes multicast=yes port=fibre promiscuous=yes
       resources: irq:37 memory:fbc00000-fbc1ffff ioport:e000(size=32) memory:fbc40000-fbc43fff memory:fa700000-fa7fffff memory:fa600000-fa6fffff


We need to disable all offloading on the network card in order for the IDS to be able to see the traffic as it is supposed to be (without checksums,tcp-segmentation-offloading and such..) Otherwise your IDPS would not be able to see all "natural" network traffic the way it is supposed to and will not inspect it properly.

This would influence the correctness of ALL outputs including file extraction. So make sure all offloading features are OFF !!!

When you first install the drivers and card your offloading settings might look like this:
root@suricata:/home/pevman/ixgbe-3.18.7/scripts# ethtool -k eth3
Offload parameters for eth3:
rx-checksumming: on
tx-checksumming: on
scatter-gather: on
tcp-segmentation-offload: on
udp-fragmentation-offload: off
generic-segmentation-offload: on
generic-receive-offload: on
large-receive-offload: on
rx-vlan-offload: on
tx-vlan-offload: on
ntuple-filters: off
receive-hashing: on
root@suricata:/home/pevman/ixgbe-3.18.7/scripts#

So we disable all of them, like so (and we load balance the UDP flows for that particular network card):

ethtool -K eth3 tso off
ethtool -K eth3 gro off
ethtool -K eth3 ufo off
ethtool -K eth3 lro off
ethtool -K eth3 gso off
ethtool -K eth3 rx off
ethtool -K eth3 tx off
ethtool -K eth3 sg off
ethtool -K eth3 rxvlan off
ethtool -K eth3 txvlan off
ethtool -N eth3 rx-flow-hash udp4 sdfn
ethtool -N eth3 rx-flow-hash udp6 sdfn
ethtool -C eth3 rx-usecs 1 rx-frames 0
ethtool -C eth3 adaptive-rx off

Your output should look something like this:
root@suricata:/home/pevman/ixgbe-3.18.7/scripts# ethtool -K eth3 tso off
root@suricata:/home/pevman/ixgbe-3.18.7/scripts# ethtool -K eth3 gro off
root@suricata:/home/pevman/ixgbe-3.18.7/scripts# ethtool -K eth3 lro off
root@suricata:/home/pevman/ixgbe-3.18.7/scripts# ethtool -K eth3 gso off
root@suricata:/home/pevman/ixgbe-3.18.7/scripts# ethtool -K eth3 rx off
root@suricata:/home/pevman/ixgbe-3.18.7/scripts# ethtool -K eth3 tx off
root@suricata:/home/pevman/ixgbe-3.18.7/scripts# ethtool -K eth3 sg off
root@suricata:/home/pevman/ixgbe-3.18.7/scripts# ethtool -K eth3 rxvlan off
root@suricata:/home/pevman/ixgbe-3.18.7/scripts# ethtool -K eth3 txvlan off
root@suricata:/home/pevman/ixgbe-3.18.7/scripts# ethtool -N eth3 rx-flow-hash udp4 sdfn
root@suricata:/home/pevman/ixgbe-3.18.7/scripts# ethtool -N eth3 rx-flow-hash udp6 sdfn
root@suricata:/home/pevman/ixgbe-3.18.7/scripts# ethtool -n eth3 rx-flow-hash udp6
UDP over IPV6 flows use these fields for computing Hash flow key:
IP SA
IP DA
L4 bytes 0 & 1 [TCP/UDP src port]
L4 bytes 2 & 3 [TCP/UDP dst port]

root@suricata:/home/pevman/ixgbe-3.18.7/scripts# ethtool -n eth3 rx-flow-hash udp4
UDP over IPV4 flows use these fields for computing Hash flow key:
IP SA
IP DA
L4 bytes 0 & 1 [TCP/UDP src port]
L4 bytes 2 & 3 [TCP/UDP dst port]

root@suricata:/home/pevman/ixgbe-3.18.7/scripts# ethtool -C eth3 rx-usecs 0 rx-frames 0
root@suricata:/home/pevman/ixgbe-3.18.7/scripts# ethtool -C eth3 adaptive-rx off

Now we doublecheck and run ethtool again to verify that the offloading is OFF:
root@suricata:/home/pevman/ixgbe-3.18.7/scripts# ethtool -k eth3
Offload parameters for eth3:
rx-checksumming: off
tx-checksumming: off
scatter-gather: off
tcp-segmentation-offload: off
udp-fragmentation-offload: off
generic-segmentation-offload: off
generic-receive-offload: off
large-receive-offload: off
rx-vlan-offload: off
tx-vlan-offload: off

Ring parameters on the network card:

root@suricata:~# ethtool -g eth3
Ring parameters for eth3:
Pre-set maximums:
RX:             4096
RX Mini:        0
RX Jumbo:       0
TX:            4096
Current hardware settings:
RX:             512
RX Mini:        0
RX Jumbo:       0
TX:             512


We can increase that to the max Pre-set RX:

root@suricata:~# ethtool -G eth3 rx 4096

Then we  have a look again:

root@suricata:~# ethtool -g eth3
Ring parameters for eth3:
Pre-set maximums:
RX:             4096
RX Mini:        0
RX Jumbo:       0
TX:             4096
Current hardware settings:
RX:             4096
RX Mini:        0
RX Jumbo:       0
TX:             512

Making network changes permanent across reboots


On Ubuntu for example you can do:
root@suricata:~# crontab -e

Add the following:
# add cronjob at reboot - disbale network offload
@reboot /opt/tmp/disable-network-offload.sh

and your disable-network-offload.sh script (in this case under /opt/tmp/ ) will contain the following:


#!/bin/bash
ethtool -K eth3 tso off
ethtool -K eth3 gro off
ethtool -K eth3 ufo off
ethtool -K eth3 lro off
ethtool -K eth3 gso off
ethtool -K eth3 rx off
ethtool -K eth3 tx off
ethtool -K eth3 sg off
ethtool -K eth3 rxvlan off
ethtool -K eth3 txvlan off
ethtool -N eth3 rx-flow-hash udp4 sdfn
ethtool -N eth3 rx-flow-hash udp6 sdfn
ethtool -C eth3 rx-usecs 1 rx-frames 0
ethtool -C eth3 adaptive-rx off


with:
chmod 755 disable-network-offload.sh
To make sure you have the ixgbe module always loaded at boot time you can add "ixgbe" to the  /etc/modules file.

Kernel specific tunning


Certain adjustments in parameters in the kernel can help as well :

sysctl -w net.core.netdev_max_backlog=250000
sysctl -w net.core.rmem_max=16777216
sysctl -w net.core.rmem_default=16777216
sysctl -w net.core.optmem_max=16777216


Making kernel changes permanent across reboots


example:
echo 'net.core.netdev_max_backlog=250000' >> /etc/sysctl.conf

reload the changes:
sysctl -p

OR for all the above adjustments:

echo 'net.core.netdev_max_backlog=250000' >> /etc/sysctl.conf
echo 'net.core.rmem_max=16777216' >> /etc/sysctl.conf
echo 'net.core.rmem_default=16777216' >> /etc/sysctl.conf
echo 'net.core.optmem_max=16777216' >> /etc/sysctl.conf
sysctl -p


Suricata.yaml configuration  (file extraction specific)

As of Suricata 1.2  - it is possible to detect and extract/store over 5000 types of files from HTTP sessions.

Specific file extraction instructions can also be found in the official page documentation.

The following libraries are needed on the system running Suricata :
apt-get install libnss3-dev libnspr4-dev

Suricata also needs to be compiled with file extraction enabled (not covered here).

In short in the suriacta.yaml, those are the sections below that can be tuned/configured and affect the file extraction and logging:
(the bigger the mem values the better on a busy link )


  - eve-log:
      enabled: yes
      type: file #file|syslog|unix_dgram|unix_stream
      filename: eve.json
      # the following are valid when type: syslog above
      #identity: "suricata"
      #facility: local5
      #level: Info ## possible levels: Emergency, Alert, Critical,
                   ## Error, Warning, Notice, Info, Debug
      types:
        - alert
        - http:
            extended: yes     # enable this for extended logging information
        - dns
        - tls:
            extended: yes     # enable this for extended logging information
        - files:
            force-magic: yes   # force logging magic on all logged files
            force-md5: yes     # force logging of md5 checksums
        #- drop
        - ssh


For file store to disk/extraction:
   - file-store:
      enabled: yes       # set to yes to enable
      log-dir: files    # directory to store the files
      force-magic: yes   # force logging magic on all stored files
      force-md5: yes     # force logging of md5 checksums
      #waldo: file.waldo # waldo file to store the file_id across runs


 stream:
  memcap: 32mb
  checksum-validation: no      # reject wrong csums
  inline: auto                  # auto will use inline mode in IPS mode, yes or no set it statically
  reassembly:
    memcap: 128mb
    depth: 1mb                  # reassemble 1mb into a stream
  
depth: 1mb , would mean that in one tcp reassembled flow, the max size of the file that can be extracted is just about 1mb.

Both stream.memcap and reassembly.memcap (if reassembly is needed) must be big enough to accommodate the whole file on the fly in traffic that needs to be extracted PLUS any other stream and reassembly tasks that the engine needs to do while inspecting the traffic on a particular link.

 app-layer:
  protocols:
....
....
     http:
      enabled: yes
      # memcap: 64mb

The default limit for mem usage for http is 64mb   , that could be increased , ex - memcap: 4GB -  since HTTP is present everywhere and a low memcap on a busy HTTP link would limit the inspection and extraction size ability.

       libhtp:

         default-config:
           personality: IDS

           # Can be specified in kb, mb, gb.  Just a number indicates
           # it's in bytes.
           request-body-limit: 3072
           response-body-limit: 3072

The default values above control how far the HTTP request and response body is tracked and also limit file inspection. This should be set to a much higher value:

        libhtp:

         default-config:
           personality: IDS

           # Can be specified in kb, mb, gb.  Just a number indicates
           # it's in bytes.
           request-body-limit: 1gb
           response-body-limit: 1gb

 or 0 (which would mean unlimited):

       libhtp:

         default-config:
           personality: IDS

           # Can be specified in kb, mb, gb.  Just a number indicates
           # it's in bytes.
           request-body-limit: 0
           response-body-limit: 0

and then of course you would need a rule loaded(example):
alert http any any -> any any (msg:"PDF file Extracted"; filemagic:"PDF document"; filestore; sid:11; rev:11;)


That's it.


Saturday, March 15, 2014

Suricata (and the grand slam of) Open Source IDPS - Chapter IV - Logstash / Kibana / Elasticsearch, Part One


Introduction 


This article covers old installation instructions for Logstash 1.3.3 and prior. There is an UPDATED article - http://pevma.blogspot.se/2014/03/suricata-and-grand-slam-of-open-source_26.html that covers the new (at the time of this writing) 1.4.0 Logstash release.


This is Chapter IV of a series of 4 articles aiming at giving a general guideline on how to deploy the Open Source Suricata IDPS on a high speed networks (10Gbps) in IDS mode using AF_PACKET, PF_RING or DNA and Logstash / Kibana / Elasticsearch

This chapter consist of two parts:
Chapter IV Part One - installation and set up of logstash.
Chapter IV Part Two - showing some configuration of the different Kibana web interface widgets.

The end result should be as many and as different widgets to analyze the Suricata IDPS logs , something like :


This chapter describes a quick and easy set up of Logstash / Kibana / Elasticsearch
This set up described in this chapter was not intended for a huge deployment, but rather a conceptual proof in a working environment as pictured below:


We have two Suricata IDS deployed - IDS1 and IDS2
  • IDS2 uses logstash-forwarder (former lumberjack) to securely forward (SSL encrypted) its eve.json logs (configured in suricata.yaml) to IDS1, main Logstash/Kibana deployment.
  • IDS1 has its own logging (eve.json as well) that is also digested by Logstash.

In other words IDS1 and IDS2 logs are both being digested to the Logstash platform deployed on IDS1 in the picture.

Prerequisites

Both IDS1 and IDS2 should be set up and tuned with Suricata IDPS. This article will not cover that. If you have not done it you could start HERE.

Make sure you have installed Suricata with JSON availability. The following two packages must be present on your system prior to installation/compilation:
root@LTS-64-1:~# apt-cache search libjansson
libjansson-dev - C library for encoding, decoding and manipulating JSON data (dev)
libjansson4 - C library for encoding, decoding and manipulating JSON data
If there are not present on the system  - install them:
apt-get install libjansson4 libjansson-dev

In both IDS1 and IDS2 you should have in your suricata.yaml:
  # "United" event log in JSON format
  - eve-log:
      enabled: yes
      type: file #file|syslog|unix_dgram|unix_stream
      filename: eve.json
      # the following are valid when type: syslog above
      #identity: "suricata"
      #facility: local5
      #level: Info ## possible levels: Emergency, Alert, Critical,
                   ## Error, Warning, Notice, Info, Debug
      types:
        - alert
        - http:
            extended: yes     # enable this for extended logging information
        - dns
        - tls:
            extended: yes     # enable this for extended logging information
        - files:
            force-magic: yes   # force logging magic on all logged files
            force-md5: yes     # force logging of md5 checksums
        #- drop
        - ssh
This tutorial uses /var/log/suricata as a default logging directory.

You can do a few dry runs to confirm log generation on both systems.
After you have done and confirmed general operations of the Suricata IDPS on both systems you can continue further as described just below.

Installation

IDS2

For the logstash-forwarder we need Go installed.

cd /opt
apt-get install hg-fast-export
hg clone -u release https://code.google.com/p/go
cd go/src
./all.bash


If everything goes ok you should see at the end:
ALL TESTS PASSED


Update your $PATH variable, in  make sure it has:
PATH=$PATH:/opt/go/bin
export PATH

root@debian64:~# nano  ~/.bashrc


edit the file (.bashrc), add at the bottom:

PATH=$PATH:/opt/go/bin
export PATH

 then:

root@debian64:~# source ~/.bashrc
root@debian64:~# echo $PATH
/usr/local/sbin:/usr/local/bin:/usr/sbin:/usr/bin:/sbin:/bin:/opt/go/bin


Install logstash-forwarder:
cd /opt
git clone git://github.com/elasticsearch/logstash-forwarder.git
cd logstash-forwarder
go build

Build a debian package:
apt-get install ruby ruby-dev
gem install fpm
make deb
That will produce a Debian package in the same directory (something like):
logstash-forwarder_0.3.1_amd64.deb

Install the Debian package:
root@debian64:/opt# dpkg -i logstash-forwarder_0.3.1_amd64.deb

 NOTE: You can use the same Debian package to copy and install it (dependency free) on other machines/servers. So once you have the deb package you can install it on any other server the same way, no need for rebuilding everything again (Go and ruby)

Create SSL certificates that will be used to securely encrypt and transport the logs:
cd /opt
openssl req -x509 -batch -nodes -newkey rsa:2048 -keyout logstash-forwarder.key -out logstash-forwarder.crt

Copy to BOTH IDS1 and IDS2:
logstash-forwarder.key in /etc/ssl/private/
logstash-forwarder.crt in /etc/ssl/certs/

Now you can try to start/restart/stop the logstash-forwarder service:
root@debian64:/opt# /etc/init.d/logstash-forwarder start
root@debian64:/opt# /etc/init.d/logstash-forwarder status
[ ok ] logstash-forwarder is running.
root@debian64:/opt# /etc/init.d/logstash-forwarder stop
root@debian64:/opt# /etc/init.d/logstash-forwarder status
[FAIL] logstash-forwarder is not running ... failed!
root@debian64:/opt# /etc/init.d/logstash-forwarder start
root@debian64:/opt# /etc/init.d/logstash-forwarder status
[ ok ] logstash-forwarder is running.
root@debian64:/opt# /etc/init.d/logstash-forwarder stop
root@debian64:/opt#
Good to go.

Create on IDS2 your logstash-forwarder config:
touch /etc/logstash-forwarder
Make sure the file looks like this (in this tutorial - copy/paste):

{
  "network": {
    "servers": [ "192.168.1.158:5043" ],
    "ssl certificate": "/etc/ssl/certs/logstash-forwarder.crt",
    "ssl key": "/etc/ssl/private/logstash-forwarder.key",
    "ssl ca": "/etc/ssl/certs/logstash-forwarder.crt"
  },
  "files": [
    {
      "paths": [ "/var/log/suricata/eve.json" ],
      "codec": { "type": "json" }
    }
  ]
}

This is as far as the set up on IDS2 goes....

IDS1 - indexer

Download Logstash (change or create directory names to whichever suits you best):
cd /root/Work/tmp/Logstash
wget https://download.elasticsearch.org/logstash/logstash/logstash-1.3.3-flatjar.jar

Download the GoeIP lite data needed for our geoip location:
wget -N http://geolite.maxmind.com/download/geoip/database/GeoLiteCity.dat.gz
gunzip GeoLiteCity.dat.gz

Create your logstash conf file:
touch /etc/init.d/logstash.conf

Make sure it looks like this (change directory names accordingly):
input {
  file {
    path => "/var/log/suricata/eve.json"
    codec =>   json
    # This format tells logstash to expect 'logstash' json events from the file.
    #format => json_event
  }
 
  lumberjack {
  port => 5043
  type => "logs"
  codec =>   json
  ssl_certificate => "/etc/ssl/certs/logstash-forwarder.crt"
  ssl_key => "/etc/ssl/private/logstash-forwarder.key"
  }
}


output {
  stdout { codec => rubydebug }
  elasticsearch { embedded => true }
}

#geoip part
filter {
  if [src_ip] {
    geoip {
      source => "src_ip"
      target => "geoip"
      database => "/root/Work/tmp/Logstash/GeoLiteCity.dat"
      add_field => [ "[geoip][coordinates]", "%{[geoip][longitude]}" ]
      add_field => [ "[geoip][coordinates]", "%{[geoip][latitude]}"  ]
    }
    mutate {
      convert => [ "[geoip][coordinates]", "float" ]
    }
  }
}


Create a startup script:
touch /etc/init.d/logstash-startup.conf

Make sure it looks like this (change directories accordingly):
# logstash - indexer instance
#

description     "logstash indexer instance using ports 9292 9200 9300 9301"

start on runlevel [345]
stop on runlevel [!345]

#respawn
#respawn limit 5 30
#limit nofile 65550 65550
expect fork

script
  test -d /var/log/logstash || mkdir /var/log/logstash
  chdir /root/Work/Logstash/
  exec sudo java -jar /root/Work/tmp/Logstash/logstash-1.3.3-flatjar.jar agent -f /etc/init/logstash.conf --log /var/log/logstash/logstash-indexer.out -- web &
end script


Then:
initctl reload-configuration   

 Rolling it out


On IDS1 and IDS2 - start Suricata IDPS. Genereate some logs
On IDS1:
service logstash-startup start

On IDS2:
root@debian64:/opt# /etc/init.d/logstash-forwarder start
You can check if it is working properly like so - > tail -f /var/log/syslog :


Go to your browser and navigate to (in this case IDS1)
http://192.168.1.158:9292
NOTE: This is http (as this is just a simple tutorial), you should configure it to use httpS

The Kibana web interface should come up.

That is it. From here on it is up to you to configure the web interface with your own widgets.

Chapter IV Part Two will follow with detail on that subject.
However something like this is easily achievable with a few clicks in under 5 min:


Troubleshooting:

You should keep an eye on /var/log/logstash/logstash-indexer.out - any troubles should be visible there.

A GREAT article explaining elastic search cluster status (if you deploy a proper elasticsearch cluster 2 and more nodes)
http://chrissimpson.co.uk/elasticsearch-yellow-cluster-status-explained.html

ERR in logstash-indexer.out - too many open files
http://www.elasticsearch.org/tutorials/too-many-open-files/

Set ulimit parameters on Ubuntu(this is in case you need to increase the number of Inodes(files) available on a system "df -ih"):
http://posidev.com/blog/2009/06/04/set-ulimit-parameters-on-ubuntu/

This is an advanced topic - Cluster status and settings commands:
 curl -XGET 'http://localhost:9200/_cluster/health?pretty=true'

 curl -XGET 'http://localhost:9200/_status?pretty=true'

 curl -XGET 'http://localhost:9200/_nodes?os=true&process=true&pretty=true'


Very useful links:

A MUST READ (explaining the usage of ".raw" in terms so that the terms  re not broken by space delimiter)
http://www.elasticsearch.org/blog/logstash-1-3-1-released/

Article explaining how to set up a 2 node cluster:
http://techhari.blogspot.se/2013/03/elasticsearch-cluster-setup-in-2-minutes.html

Installing Logstash Central Server (using rsyslog):
https://support.shotgunsoftware.com/entries/23163863-Installing-Logstash-Central-Server

ElasticSearch cluster setup in 2 minutes:
http://techhari.blogspot.com/2013/03/elasticsearch-cluster-setup-in-2-minutes.html


Sunday, February 23, 2014

Signing Windows installation MSI packages with a certificate


This article will describe how to sign your windows installer (MSI) packages with a certificate. For that you need three things in place:
  1. p12 certificate file - Personal Information Exchange (.p12)
  2. the msi package
  3. Windows Software Development Kit (SDK) installed (for your respective windows installation)
In order to sign your package you need a Code Signing Certificate.
INFO:  Certum  offers free code certificates for open source projects - Open Source Code Signing, at the time of this writing.


After you have all of the above three prerequisites -> this below is the two ways to sign in Windows 7 and Windows 8 respectively:
(Execute the following and substitute your directory, names and password correctly!! In other words - substitute the bold text below plus the web link)

Windows 7


c:\Users\peter.manev>"C:\Program Files\Microsoft SDKs\Windows\v7.1\Bin\signtool.exe"  sign /v /f my-p12-file.p12 /p "PASSWORD-FOR-p12-HERE" /d "My install package is very cool and is about this" /du "http://www.info-for-my-project.org/" /t http://timestamp.verisign.com/scripts/timstamp.dll my-win-installer-package.msi


Windows 8

c:\Users\peter.manev>"C:\Program Files (x86)\Windows Kits\8.0\bin\x86\signtool.exe"  ssign /v /f my-p12-file.p12 /p "PASSWORD-FOR-p12-HERE" /d "My install package is very cool and is about this" /du "http://www.info-for-my-project.org/" /t http://timestamp.verisign.com/scripts/timstamp.dll my-win-installer-package.msi

The result should be something like this:
The following certificate was selected:
    Issued to: Open Source Developer, Developers Team
    Issued by: Certum Level III CA
    Expires:   Thu Mar 20 08:07:06 2014
    SHA1 hash: XXXXXXXXXXXXXXXXXXXXXXXXXXXXXXX

Done Adding Additional Store
Successfully signed: my-win-installer-package.msi

Number of files successfully Signed: 1
Number of warnings: 0
Number of errors: 0

Sunday, February 16, 2014

Suricata IDPS installation on OpenSUSE


This is a quick tutorial of how to install Suricata IDPS (latest dev edition from git) on OpenSUSE with MD5/file extraction and GeoIP features enabled.

For this tutorial we use OpenSUSE 13.1 (Bottle) (x86_64) 64-bit  with 3.11.6 kernel level:

uname -a
Linux linux-560z.site 3.11.6-4-desktop #1 SMP PREEMPT Wed Oct 30 18:04:56 UTC 2013 (e6d4a27) x86_64 x86_64 x86_64 GNU/Linux 

Step 1

Install the needed packages:
zypper install gcc zlib-devel libtool make libpcre1 autoconf automake gcc-c++ pcre-devel libz1 file-devel libnet1 libpcap1 libpcap-devel libnet-devel libyaml-devel libyaml-0-2 git-core wget libcap-ng0 libcap-ng-devel libmagic1 file-magic

Step 2

For MD5 functionality and file extraction capability:
zypper install mozilla-nss mozilla-nss-devel mozilla-nspr mozilla-nspr-devel mozilla-nss-tools

Step 3 

For the GeoIP functionality:
zypper install GeoIP libGeoIP-devel

Step 4

Git clone the latest dev branch,compile and configure(one liner, copy paste ready):

git clone git://phalanx.openinfosecfoundation.org/oisf.git \
&& cd oisf/\
&&  git clone https://github.com/ironbee/libhtp.git -b 0.5.x \
&& ./autogen.sh \
&& ./configure --prefix=/usr/ --sysconfdir=/etc/ --localstatedir=/var/ \
--disable-gccmarch-native --enable-gccprotect \
--enable-geoip \
--with-libnss-libraries=/usr/lib64 \
--with-libnss-includes=/usr/include/nss3 \
&& make clean && make && make install \
&& ldconfig

NOTE:
You can change make install (above) to make install-full for an automated full set up -> directory creation, rule download and directory set up in suricata.yaml - everything ready to run!


Step 5

Some commands to confirm everything is in place:
which suricata
suricata --build-info
ldd `which suricata` 


Step 6 

Continue with basic set up of your networks,which rules to enable and other  suricata.yaml config options...Basic Setup


After you are done with all the config options, you can start it like so:
suricata -c /etc/suricata/suricata.yaml -i enp0s3
change your interface name accordingly !

NOTE:
if you get the following err:
 (util-magic.c:65) <Warning> (MagicInit) -- [ERRCODE: SC_ERR_FOPEN(44)] - Error opening file: "/usr/share/file/magic": No such file or directory

change the following line in your suriacta.yaml from:
magic-file: /usr/share/file/magic
to
magic-file: /usr/share/misc/magic


That's all.


Saturday, February 15, 2014

Suricata - override config parameters on the command line


With the release of 2.0rc1 , Suricata IDPS introduced a feature/possibility to override config parameters.
This is a brief article to give you the idea of how to  override config parameters  when you start the Suricata on the command line at will/on demand without having to edit/save the suricata.yaml config for that.

This article follows the initial instruction posted HERE....PLUS some extra examples.

There are three sections in the article:
  • First Step
  • Overriding multiple parameters
  • Take it to the next level
  • Where to get the values from

First step

So how does it work. Simple , you should use the "--set <parameter=value>" syntax:
suricata -c /etc/suricata/suricata.yaml  -i eth0 -v -S empty.rules --set threading.detect-thread-ratio=3

So imagine you start Suricata on the command line like so:
root@LTS-64-1:~/Work/tmp# suricata -c /etc/suricata/suricata.yaml  --af-packet -v -S empty.rules
 - (suricata.c:973) <Notice> (SCPrintVersion) -- This is Suricata version 2.0dev (rev f791d0f)
 - (util-cpu.c:170) <Info> (UtilCpuPrintSummary) -- CPUs/cores online: 2
...
in suricata yaml in your af-packet section you have
af-packet:
  - interface: eth0
    # Number of receive threads (>1 will enable experimental flow pinned
    # runmode)
    threads: 6


and you get :
.....
 - (stream-tcp-reassemble.c:456) <Info> (StreamTcpReassemblyConfig) -- stream.reassembly "chunk-prealloc": 250
 - (tm-threads.c:2196) <Notice> (TmThreadWaitOnThreadInit) -- all 6 packet processing threads, 3 management threads initialized, engine started.
....

Then you can try the follwoing:
root@LTS-64-1:~/Work/tmp# suricata -c /etc/suricata/suricata.yaml  --af-packet -v -S empty.rules --set  af-packet.0.threads=4
 - (suricata.c:973) <Notice> (SCPrintVersion) -- This is Suricata version 2.0dev (rev f791d0f)
 - (util-cpu.c:170) <Info> (UtilCpuPrintSummary) -- CPUs/cores online: 2
....


and you would get:
....
 - (tm-threads.c:2196) <Notice> (TmThreadWaitOnThreadInit) -- all 4 packet processing threads, 3 management threads initialized, engine started.
...

Simple.

Now lets try to chage some memory settings on the fly. If in your suricata.yaml you have :

stream:
  memcap: 32mb
  checksum-validation: yes      # reject wrong csums
  inline: auto                  # auto will use inline mode in IPS mode, yes or no set it statically
  reassembly:
    memcap: 64mb
    depth: 1mb                  # reassemble 1mb into a stream
    toserver-chunk-size: 2560
    toclient-chunk-size: 2560
    randomize-chunk-size: yes
    #randomize-chunk-range: 10
which is the default settings. When you start Suricata without overriding any values, it will have something like this most likely:
root@LTS-64-1:~/Work/tmp# suricata -c /etc/suricata/suricata.yaml  -i eth0 -v -S empty.rules
....
- (stream-tcp.c:373) <Info> (StreamTcpInitConfig) -- stream "prealloc-sessions": 2048 (per thread)
- (stream-tcp.c:389) <Info> (StreamTcpInitConfig) -- stream "memcap": 33554432
- (stream-tcp.c:395) <Info> (StreamTcpInitConfig) -- stream "midstream" session pickups: disabled
- (stream-tcp.c:401) <Info> (StreamTcpInitConfig) -- stream "async-oneside": disabled
- (stream-tcp.c:418) <Info> (StreamTcpInitConfig) -- stream "checksum-validation": enabled
- (stream-tcp.c:440) <Info> (StreamTcpInitConfig) -- stream."inline": disabled
- (stream-tcp.c:453) <Info> (StreamTcpInitConfig) -- stream "max-synack-queued": 5
- (stream-tcp.c:471) <Info> (StreamTcpInitConfig) -- stream.reassembly "memcap": 67108864
- (stream-tcp.c:489) <Info> (StreamTcpInitConfig) -- stream.reassembly "depth": 1048576
....

Lets say you want to double the stream reassembly memcap settings because you are seeing a lot of drops and you want to determine of this is the issue. The you could try:
root@LTS-64-1:~/Work/tmp# suricata -c /etc/suricata/suricata.yaml  -i eth0 -v -S empty.rules --set stream.reassembly.memcap=512mb
- (stream-tcp.c:373) <Info> (StreamTcpInitConfig) -- stream "prealloc-sessions": 2048 (per thread)
 - (stream-tcp.c:389) <Info> (StreamTcpInitConfig) -- stream "memcap": 33554432
 - (stream-tcp.c:395) <Info> (StreamTcpInitConfig) -- stream "midstream" session pickups: disabled
 - (stream-tcp.c:401) <Info> (StreamTcpInitConfig) -- stream "async-oneside": disabled
 - (stream-tcp.c:418) <Info> (StreamTcpInitConfig) -- stream "checksum-validation": enabled
 - (stream-tcp.c:440) <Info> (StreamTcpInitConfig) -- stream."inline": disabled
 - (stream-tcp.c:453) <Info> (StreamTcpInitConfig) -- stream "max-synack-queued": 5
 - (stream-tcp.c:471) <Info> (StreamTcpInitConfig) -- stream.reassembly "memcap": 536870912
 - (stream-tcp.c:489) <Info> (StreamTcpInitConfig) -- stream.reassembly "depth": 1048576

and there it is 512MB of stream reassembly memcap.

You could override all the variables in suricata.yaml that way. Another example:
root@LTS-64-1:~/Work/tmp# suricata -c /etc/suricata/suricata.yaml  -i eth0 -v -S empty.rules --set flow-timeouts.tcp.established=720


this would change the tcp timeouts to 720 seconds. The corresponding default section for the example above in the suricata.yaml will be:

flow-timeouts:

  default:
    new: 30
    established: 300
    closed: 0
    emergency-new: 10
    emergency-established: 100
    emergency-closed: 0
  tcp:
    new: 60
    established: 3600
    closed: 120
    emergency-new: 10
    emergency-established: 300
    emergency-closed: 20


Override multiple parameters

Sure, no problem:
root@LTS-64-1:~/Work/tmp# suricata -c /etc/suricata/suricata.yaml  -i eth0 -v -S empty.rules --set flow-timeouts.tcp.established=720 --set stream.reassembly.memcap=512mb


Take it to the next level

Here you go:
src/suricata --af-packet=${NIC_IN} -S /dev/null -c suricata.yaml -l "${TD}/logs" -D --pidfile="${TD}/suricata.pid" --set "logging.outputs.1.file.enabled=yes" --set "logging.outputs.1.file.filename=${TD}/logs/suricata.log" --set "af-packet.0.interface=eth2" --set "af-packet.0.threads=4" --set "flow.memcap=256mb" --set "stream.reassembly.memcap=512mb" --runmode=workers --set "af-packet.0.buffer-size=8388608"
Yep ... one liner :)  - my favorites, compliments to Victor Julien. 
You could use variables too !  Handy...very handy I believe.


Where to get the key/values from

( thanks to a friendly reminder form regit )

So how do you know what are the key value pairs..aka where do i get the key and value for af-packet.0.buffer-size=8388608

key ->  af-packet.0.buffer-size
value -> 8388608
(the value is the one that you can adjust)

Easy, just issue a "suricata --dump-config" comand on the pc/server that you have Suricata installed:

root@LTS-64-1:~# suricata --dump-config
15/2/2014 -- 10:39:02 - <Notice> - This is Suricata version 2.0rc1 RELEASE
host-mode = auto
default-log-dir = /var/log/suricata/
unix-command = (null)
unix-command.enabled = yes
outputs = (null)
outputs.0 = fast
outputs.0.fast = (null)
outputs.0.fast.enabled = yes
outputs.0.fast.filename = fast.log
outputs.0.fast.append = no
outputs.1 = eve-log
outputs.1.eve-log = (null)
outputs.1.eve-log.enabled = yes
outputs.1.eve-log.type = file
outputs.1.eve-log.filename = eve.json
outputs.1.eve-log.types = (null)
outputs.1.eve-log.types.0 = alert
outputs.1.eve-log.types.1 = http
outputs.1.eve-log.types.1.http = (null)
outputs.1.eve-log.types.1.http.extended = yes
outputs.1.eve-log.types.2 = dns
outputs.1.eve-log.types.3 = tls
outputs.1.eve-log.types.3.tls = (null)
outputs.1.eve-log.types.3.tls.extended = yes
outputs.1.eve-log.types.4 = files
outputs.1.eve-log.types.4.files = (null)
outputs.1.eve-log.types.4.files.force-magic = no
outputs.1.eve-log.types.4.files.force-md5 = no
...
...
...
vlan.use-for-tracking = true
flow-timeouts = (null)
flow-timeouts.default = (null)
flow-timeouts.default.new = 30
flow-timeouts.default.established = 300
flow-timeouts.default.closed = 0
flow-timeouts.default.emergency-new = 10
flow-timeouts.default.emergency-established = 100
flow-timeouts.default.emergency-closed = 0
flow-timeouts.tcp = (null)
flow-timeouts.tcp.new = 60
flow-timeouts.tcp.established = 3600
flow-timeouts.tcp.closed = 120
flow-timeouts.tcp.emergency-new = 10
flow-timeouts.tcp.emergency-established = 300
flow-timeouts.tcp.emergency-closed = 20
flow-timeouts.udp = (null)
flow-timeouts.udp.new = 30
flow-timeouts.udp.established = 300
flow-timeouts.udp.emergency-new = 10
flow-timeouts.udp.emergency-established = 100
flow-timeouts.icmp = (null)
flow-timeouts.icmp.new = 30
flow-timeouts.icmp.established = 300
flow-timeouts.icmp.emergency-new = 10
flow-timeouts.icmp.emergency-established = 100
stream = (null)
stream.memcap = 32mb
stream.checksum-validation = yes
stream.inline = auto
stream.reassembly = (null)
stream.reassembly.memcap = 64mb
stream.reassembly.depth = 1mb
stream.reassembly.toserver-chunk-size = 2560
stream.reassembly.toclient-chunk-size = 2560
stream.reassembly.randomize-chunk-size = yes

.......

it will be a LONG list, but you get all the key value pairs from that :)


Tuesday, February 11, 2014

Github for beginners - how to start your own repository - step by step


This is a brief article how to start your own github repository and push updates to it.

Powerful collaboration, code review, and code management for open source and private projects.

Steps:
1)
Create a new account and sign up at github

2)
Create  a git repo - log in to github and create a new repo

Example:


then add README , licenses ....(check/uncheck the selection boxes):


3)
Ona linux machine , make sure you have:
apt-get install git-core


Then in hte directory where you have your files and folders (the directory where the code that you would like to upload to github for sharing):

git init
git add <every single file/dir one by one>
git commit -a -m "First commit message - initial upload"
git remote add origin https://github.com/pevma/MyNewRepoName.git
git fetch origin
git rebase origin/master
git push -u origin master
NOTE: Make sure you change the name of your repository accordingly!!
Done!

4)
When you are doing changes in the code directory on your machine/PC...to update the github repo:

git commit -a -m 'Some meaningful message !'
git push -u origin master

This is enough to get you gihubbing :) and most likely , the more you use it , the more you are going to like it. At least that is my case.