Sunday, December 7, 2014

Suricata - disable detection mode


There is a trick for using Suricata IDS/IPS that has come in handy - in my experience that I thought  would share and might be useful to others.

My HW was CPU 1x E5-2680 with 64 GB RAM ,  NIC a  82599EB 10-Gigabit SFI/SFP+ and mirroring about 9,5Gbps:


So I wanted to get a better understanding of what is the max log output from Suricata in that particular environment without putting detection into consideration. Just pure event logging and profiling - DNS,HTTP,TLS,SSH, File transactions, SMTP all of these.

Suricata offers just that - with a really low need for HW (having in mind we are looking at 9,5Gbps). What i did was compile suricata with the "--disable-detection" switch. What it does it simply disables detection(alerts) in Suricata  - however every other logging/parsing capability is preserved ( DNS,HTTP,TLS,SSH, File transactions, SMTP). So i downloaded a fresh copy:

git clone git://phalanx.openinfosecfoundation.org/oisf.git && cd oisf/ &&  git clone https://github.com/ironbee/libhtp.git -b 0.5.x

then

./autogen.sh && ./configure --disable-detection   &&  make clean && make && make install &&  ldconfig

enabled all JSON outputs in the eve-log section in suricata.yaml. I confirmed that detection was disabled:


and started Suricata.

Careful what you asked for :) - I was getting 10-15K logs per second :

 root@suricata:/var/log/suricata# tail -f  eve.json |perl -e 'while (<>) {$l++;if (time > $e) {$e=time;print "$l\n";$l=0}}'
1
6531
13860
10704
10877
10389
10664
10205
9996
14798
15427
14223

And the HW(CPU/RAM/HDD) usage was not much at all:


As you can see - 30-40% CPU with a third of RAM  usage.

 I used this command to count logs per second  -
tail -f  eve.json |perl -e 'while (<>) {$l++;if (time > $e) {$e=time;print "$l\n";$l=0}}'
more about similar commands and counting Suricata logs you could find here:


So this can came in handy in a few scenarious:
  • you can  actually do a  "profiling" run on that particular set up in order to size up a SIEM specification 
  • and/or you can size up your prod IDS/IPS deployment needs
  • you can also just feed all those logs info to an existing log analysis system

Thanks

Suricatasc unix socket interaction for Suricata IDS/IPS


Suricatasc is a unix socket interaction  script that is automatically installed when one compiles/installs Suricata IDS/IPS. An in depth description, prerequisites and how to documentation is located here - https://redmine.openinfosecfoundation.org/projects/suricata/wiki/Interacting_via_Unix_Socket

However  lets look at a quick usage example - that can come very handy in certain situations.

Once you have unix socket command enabled in suricata.yaml :

unix-command:
    enabled: yes
    #filename: custom.socket # use this to specify an alternate file

the traditional way to use the script would be type suricatasc and hit Enter (on the machine running Suricata):


However you can also use it directly as a command line parameter for example :
root@suricata:~# suricatasc -c version

like so:


NOTE:
You need to quote commands involving interfaces:
root@debian64:~# suricatasc -c "iface-stat eth0"


Very handy when you want quick interaction and info from the currently running Suricata IDS/IPS.


Sunday, October 26, 2014

Suricata ids/ips - dropping privileges


This tutorial is intended for Linux (Debian/Ubuntu).

Install the prerequisite packages in order to compile Suricata. I add/enable some optional features so in my case I usually do:
apt-get -y install libpcre3 libpcre3-dbg libpcre3-dev \
build-essential autoconf automake libtool libpcap-dev libnet1-dev \
libyaml-0-2 libyaml-dev zlib1g zlib1g-dev make flex bison \
libmagic-dev

For Eve (all JSON output):
apt-get install libjansson-dev libjansson4
For MD5 support(file extraction):
apt-get install libnss3-dev libnspr4-dev
For GeoIP:
apt-get install libgeoip1 libgeoip-dev
For nfqueue(ips mode):
apt-get install libnetfilter-queue-dev libnetfilter-queue1 libnfnetlink-dev libnfnetlink0
For the dropping privileges part you can simply do:
apt-get install libcap-ng0 libcap-ng-dev

OR get the latest libcap-ng version form here:
http://people.redhat.com/sgrubb/libcap-ng/
like so:

wget http://people.redhat.com/sgrubb/libcap-ng/libcap-ng-0.7.4.tar.gz
tar -zxf libcap-ng-0.7.4.tar.gz
cd libcap-ng-0.7.4
./configure && make && make install
cd ..

Let's fetch and compile Suricata:
wget http://www.openinfosecfoundation.org/download/suricata-2.0.4.tar.gz
tar -xzf suricata-2.0.4.tar.gz 
cd suricata-2.0.4
 One liner... one of my favorite:

./configure --prefix=/usr/ --sysconfdir=/etc/ --localstatedir=/var/ --disable-gccmarch-native \
--enable-geoip --with-libnss-libraries=/usr/lib --with-libnss-includes=/usr/include/nss/ \
--enable-nfqueue \
--with-libcap_ng-libraries=/usr/local/lib --with-libcap_ng-includes=/usr/local/include \
--with-libnspr-libraries=/usr/lib --with-libnspr-includes=/usr/include/nspr && \
make clean && make && make install-full && ldconfig


Above we enable some other features like :
(
you can do like this
root@IDS:~/suricata-2.0.4# ./configure --help
to see what each option is for
)

but this line -
--with-libcap_ng-libraries=/usr/local/lib --with-libcap_ng-includes=/usr/local/include
is the one you need to compile and enable dropping privileges with Suricata.


Then you can run Suri like so
/usr/bin/suricata -c /etc/suricata/suricata.yaml --pidfile /var/run/suricata.pid --af-packet -D -v --user=logstash

Make sure the log directory has the right permissions to allow the user "logstash" to write to it.
After you start Suricata  - you should see something similar:
root@IDS:~# ls -lh /var/log/suricata/
total 77M
drwxr-xr-x 2 logstash logstash 4.0K Oct 15 13:06 certs
drwxr-xr-x 2 logstash logstash 4.0K Oct 15 13:06 core
-rw-r----- 1 logstash logstash  18M Oct 26 10:48 eve.json
-rw-r----- 1 logstash logstash 806K Oct 26 10:48 fast.log
drwxr-xr-x 2 logstash logstash 4.0K Oct 15 13:06 files
drwxr-xr-x 2 logstash logstash 4.0K Oct 26 06:26 StatsByDate
-rw-r--r-- 1 root     root      58M Oct 26 10:48 stats.log
-rw-r--r-- 1 root     root     1.1K Oct 26 09:15 suricata-start.log
root@IDS:~#
Notice the user logstash ownership.

root@IDS:~# ps aux |grep suricata
logstash  2189 11.0 10.6 420448 219972 ?       Ssl  09:15  13:04 /usr/bin/suricata -c /etc/suricata/suricata.yaml --pidfile /var/run/suricata.pid --af-packet -D -v --user=logstash
root@IDS:~#
Now you have the user logstash running (not as root) Suricata IDS/IPS.


Sunday, August 24, 2014

Suricata - more data for your alerts


As of Suricata 2.1beta1  - Suricata IDS/IPS provides the availability of packet data and information in a standard JSON output logging capability supplementing further the alert logging output.

This guide makes use of Suricata and ELK - Elasticsearch, Logstash, Kibana.
You can install all of them following the guide HERE
 ...or you can download and try out SELKS  and use directly.


After everything is in place, we need to open the suricata.yaml and make the following editions in the eve.json section:

 # "United" event log in JSON format
  - eve-log:
      enabled: yes
      type: file #file|syslog|unix_dgram|unix_stream
      filename: eve.json
      # the following are valid when type: syslog above
      #identity: "suricata"
      #facility: local5
      #level: Info ## possible levels: Emergency, Alert, Critical,
                   ## Error, Warning, Notice, Info, Debug
      types:
        - alert:

            payload: yes           # enable dumping payload in Base64
            payload-printable: yes # enable dumping payload in printable (lossy) format
            packet: yes            # enable dumping of packet (without stream segments)
            http: yes              # enable dumping of http fields
       
You can start Suricata and let it inspect traffic for some time in order to generate alert log data.
Then navigate to your Kibana web interface, find an alert record/log and you could see the usefulness of the extra data yourself.

Some examples though :) :


Lets kick it up  notch.....

We want to search through -
  1. all the generated alerts that have 
  2. a printable payload data 
  3. that have the following string: uid=0(root)
 Easy, here is the query:
 
payload_printable:"uid=0\(root\)"
You should enter it like this in Kibana:


Well what do you know - we got what we were looking for:


Some more useful reading on the Lucene Query Syntax (you should at least have a look :) ):
http://www.elasticsearch.org/guide/en/elasticsearch/reference/current/query-dsl-query-string-query.html

http://www.solrtutorial.com/solr-query-syntax.html

http://lucene.apache.org/core/2_9_4/queryparsersyntax.html


Suricata - Flows, Flow Managers and effect on performance


As of Suricata 2.1beta1  - Suricata IDS/IPS provides the availability of high performance/advanced tuning for custom thread configuration for the IDS/IPS engine management threads.

Aka ..these
[27521] 20/7/2014 -- 01:46:19 - (tm-threads.c:2206) <Notice>  (TmThreadWaitOnThreadInit) -- all 16 packet processing threads, 3 management threads initialized, engine started.


These 3 management threads initialized above are flow manager (1), counter/stats related threads (2x)

So ... in the default suricata.yaml setting we have:

flow:
  memcap: 64mb
  hash-size: 65536
  prealloc: 10000
  emergency-recovery: 30
  #managers: 1 # default to one flow manager
  #recyclers: 1 # default to one flow recycler thread

and we can choose accordingly of how many threads we would like to dedicate for the management tasks within the engine itself.
The recyclers threads offload part of the flow managers work and if enabled do flow/netflow logging.

Good !
What does this has to do with performance?

Suricata IDS/IPS is powerful, flexible and scalable - so be careful what you wish for.
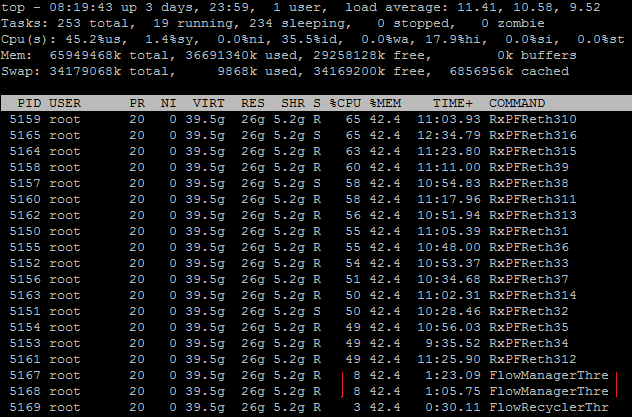
The examples below demonstrate the effect on a 10Gbps Suricata IDS sensor.

Example 1


suricata.yaml config - >
flow:
  memcap: 1gb
  hash-size: 1048576
  prealloc: 1048576
  emergency-recovery: 30
  prune-flows: 50000
  managers: 2 # default is 1

CPU usage ->

 2 flow management threads use 8% CPU each

 Example 2


suricata.yaml config - >
flow:
  memcap: 4gb
  hash-size: 15728640
  prealloc: 8000000
  emergency-recovery: 30
  managers: 2 # default is 1

 CPU usage ->

2 flow management threads use 39% CPU each as compared to Example 1 !!


So a 4 fold increase in memcap, 8 fold increase in prealloc and 15 fold increase on hash-size settings leads to about 3 fold increase in RAM consumption and 5 fold on CPU consumption  - in terms of flow management thread usage.

It would be very rare that you would need the settings in Example 2 - you need huge traffic for that...

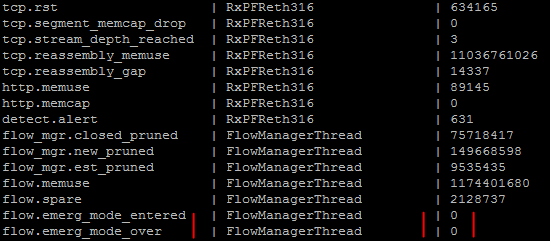
So how would you know when to tune/adjust those settings in suricata.yaml? It is recommended that you always keep an eye on your stats.log and make sure you do not enter emergency clean up mode:


it should always be 0

Some additional reading on flows and flow managers -
http://blog.inliniac.net/2014/07/28/suricata-flow-logging/


Suricata - filtering tricks for the fileinfo output with eve.json


As of Suricata 2.0  - Suricata IDS/IPS provides the availability of a standard JSON output logging capability. This guide makes use of Suricata and ELK - Elasticsearch, Logstash, Kibana.

You can install all of them following the guide HERE
 ...or you can download and try out SELKS  and use directly.

Once you have the installation in place and have the Kibana web interface up and running you can make use of the following fileinfo filters (tricks :).
You can enter the queries like so:


 fileinfo.magic:"PE32" -fileinfo.filename:*exe
will show you all "PE32 executable" executables that were seen transferred that have no exe extension in their file name:


 Alternatively
fileinfo.magic:"pdf" -fileinfo.filename:*pdf


will show you all "PDF document version......" files that were transferred that have no PDF extension in their file name.

You can explore further :)


Saturday, August 23, 2014

Suricata IDS/IPS - HTTP custom header logging


As a continuation of the article HERE- some more screenshots from the ready to use template....

For the Elasticsearch/Logstash/Kibana users there is a ready to use template that you could download from here - "HTTP-Extended-Custom"
https://github.com/pevma/Suricata-Logstash-Templates


Monday, July 28, 2014

Compiling your own perf utility tools

The perf utility is part of the linux-tools package and can be installed via :
apt-get install linux-tools

However..... if you have just installed a newer (and or custom) kernel version (as explained here for example)....let's say 3.14.0 on Ubuntu Precise ... the apt-get install would not find the appropriate linux-tools package for that kernel version.

So this is what yo can do:

apt-get install libdw-dev libnewt-dev binutils-dev git
git clone https://github.com/torvalds/linux.git
cd linux
git tag -l

Make sure you checkout the same version as on the currently installed on the system kernel.


git checkout tags/v3.14
cd tools/perf
make -j `getconf _NPROCESSORS_ONLN` perf
make install


EXAMPLE:
root@suricata:~/oisf# perf list

List of pre-defined events (to be used in -e):
  cpu-cycles OR cycles                               [Hardware event]
  instructions                                       [Hardware event]
  cache-references                                   [Hardware event]
  cache-misses                                       [Hardware event]
  branch-instructions OR branches                    [Hardware event]
  branch-misses                                      [Hardware event]
  bus-cycles                                         [Hardware event]
  stalled-cycles-frontend OR idle-cycles-frontend    [Hardware event]
  stalled-cycles-backend OR idle-cycles-backend      [Hardware event]
  ref-cycles                                         [Hardware event]

  cpu-clock                                          [Software event]
  task-clock                                         [Software event]
  page-faults OR faults                              [Software event]
  context-switches OR cs                             [Software event]
  cpu-migrations OR migrations                       [Software event]
  minor-faults                                       [Software event]
  major-faults                                       [Software event]
  alignment-faults                                   [Software event]
  emulation-faults                                   [Software event]
  dummy                                              [Software event]

  L1-dcache-loads                                    [Hardware cache event]
  L1-dcache-load-misses                              [Hardware cache event]
  L1-dcache-stores                                   [Hardware cache event]
  L1-dcache-store-misses                             [Hardware cache event]
  L1-dcache-prefetch-misses                          [Hardware cache event]
  L1-icache-load-misses                              [Hardware cache event]
  LLC-loads                                          [Hardware cache event]
  LLC-load-misses                                    [Hardware cache event]
  LLC-stores                                         [Hardware cache event]
  LLC-store-misses                                   [Hardware cache event]
  LLC-prefetches                                     [Hardware cache event]
  LLC-prefetch-misses                                [Hardware cache event]
  dTLB-loads                                         [Hardware cache event]
  dTLB-load-misses                                   [Hardware cache event]
  dTLB-stores                                        [Hardware cache event]
  dTLB-store-misses                                  [Hardware cache event]
  iTLB-loads                                         [Hardware cache event]
  iTLB-load-misses                                   [Hardware cache event]
  branch-loads                                       [Hardware cache event]
  branch-load-misses                                 [Hardware cache event]
  node-loads                                         [Hardware cache event]
  node-load-misses                                   [Hardware cache event]
  node-stores                                        [Hardware cache event]
  node-store-misses                                  [Hardware cache event]
  node-prefetches                                    [Hardware cache event]
  node-prefetch-misses                               [Hardware cache event]

  branch-instructions OR cpu/branch-instructions/    [Kernel PMU event]
  branch-misses OR cpu/branch-misses/                [Kernel PMU event]
  bus-cycles OR cpu/bus-cycles/                      [Kernel PMU event]
  cache-misses OR cpu/cache-misses/                  [Kernel PMU event]
  cache-references OR cpu/cache-references/          [Kernel PMU event]
  cpu-cycles OR cpu/cpu-cycles/                      [Kernel PMU event]
  instructions OR cpu/instructions/                  [Kernel PMU event]
  mem-loads OR cpu/mem-loads/                        [Kernel PMU event]
  mem-stores OR cpu/mem-stores/                      [Kernel PMU event]
root@suricata:~/oisf#


EXAMPLE:
root@suricata:~/oisf#perf top


..so you are back in business.

Monday, July 7, 2014

Kernel upgrade for Debian

Kernel upgrade for Debian - a quick and useful tutorial. This guide will also show how to make kernel*.deb - debian packages ready for easy "dpkg -i ..* " installation of your desired kernel version.

Some packages you might want to have on the system prior to building the new kernel:

apt-get install wget fakeroot kernel-package gcc libncurses5-dev bc ca-certificates pkg-config make flex bison build-essential autoconf automake

Choose the kernel you want to build Debian packages for from here:
https://www.kernel.org

Please make sure you read here :
https://www.kernel.org/category/faq.html
and here:
https://www.kernel.org/category/releases.html

and know the difference between "Mainline,Stable and Longterm" with regards to kernel versions.

Then you could look up the kernel version changes in here:
http://kernelnewbies.org/LinuxChanges
http://kernelnewbies.org/LinuxVersions
http://kernelnewbies.org/Linux_3.15

For the purpose of this tutorial I have chosen kernel version 3.15.1

wget https://www.kernel.org/pub/linux/kernel/v3.x/linux-3.15.1.tar.xz
tar xfJ linux-3.15.1.tar.xz
cd linux-3.15.1

If you will be updating/installing the new kernel on the same machine that you will be building it, you could do:
yes "" | make oldconfig

If you will be updating/installing the new kernel on a different machine than the one that you are building it - it is better to do:
make defconfig

More about these differences and the implications of it you can read here:
https://www.kernel.org/doc/makehelp.txt
and here
https://www.kernel.org/doc/index-old.html#Using_an_existing_configuration

    make defconfig - Set all options to default values
    make allnoconfig - Set all yes/no options to "n"
    make allyesconfig - Set all yes/no options to "y"
    make allmodconfig - Set all yes/no options to "y" and all "yes/module/no" options to "m"
    make randconfig - Set each option randomly (for debugging purposes).
    make oldconfig - Update a .config file from a previous version of the kernel to work with the current version.


Then we do:

make clean && \
make -j `getconf _NPROCESSORS_ONLN` deb-pkg LOCALVERSION=-custom KDEB_PKGVERSION=3.15.1
above
make -j `getconf _NPROCESSORS_ONLN`
means that if you have 4 CPUs it will start 4 kernel make jobs in parallel - provides for much faster building.
Now in the directory above
cd ..
you should have the new kernel.deb packages for the same architecture as the machine that you just build it on - example 64 bit

drwxrwxr-x 25 root root 4.0K Jul  7 14:40 linux-3.15.1
-rw-r--r--  1 root root  76M Jun 16 16:54 linux-3.15.1.tar.xz
-rw-r--r--  1 root root 9.9M Jul  7 14:40 linux-headers-3.15.1-custom_3.15.1_amd64.deb
-rw-r--r--  1 root root 6.1M Jul  7 14:40 linux-image-3.15.1-custom_3.15.1_amd64.deb
-rw-r--r--  1 root root 979K Jul  7 14:40 linux-libc-dev_3.15.1_amd64.deb


install as follows and then reboot:
dpkg -i linux-headers-3.15.1-custom_3.15.1_amd64.deb linux-image-3.15.1-custom_3.15.1_amd64.deb linux-libc-dev_3.15.1_amd64.deb


So only the commands themselves - as easy as one two three...:

apt-get install wget fakeroot kernel-package gcc libncurses5-dev bc ca-certificates pkg-config make flex bison build-essential autoconf automake

wget https://www.kernel.org/pub/linux/kernel/v3.x/linux-3.15.1.tar.xz

tar xfJ linux-3.15.1.tar.xz

cd linux-3.15.1

yes "" | make oldconfig

make clean && \
make -j `getconf _NPROCESSORS_ONLN` deb-pkg LOCALVERSION=-NewKernel KDEB_PKGVERSION=3.15.1

cd ..

dpkg -i linux-headers-3.15.1-custom_3.15.1_amd64.deb linux-image-3.15.1-custom_3.15.1_amd64.deb linux-libc-dev_3.15.1_amd64.deb
   
    as easy as that...

Tuesday, June 24, 2014

Suricata IDPS - getting the best out of undersized servers with BPFs on heavy traffic links


How to inspect 3-4Gbps with Suricata IDPS with 20K rules loaded on 4CPUs(2.5GHz) and 16G RAM server while having minimal drops - less than 1%

Impossible? ... definitely not...
Improbable? ...not really

Setup


3,2-4Gbps of mirrored traffic
4 X CPU  - E5420  @ 2.50GHz (4 , NOT 8 with hyper-threading, just 4)
16GB RAM
Kernel Level -  3.5.0-23-generic #35~precise1-Ubuntu SMP Fri Jan 25 17:13:26 UTC 2013 x86_64 x86_64 x86_64 GNU/Linux
Network Card - 82599EB 10-Gigabit SFI/SFP+ Network Connection
with driver=ixgbe driverversion=3.17.3
Suricata version 2.0dev (rev 896b614) - some commits above 2.0.1
20K rules - ETPro ruleset 


between 400-700K pps


If you want to run Suricata on that HW with about 20 000 rules inspecting 3-4Gbps traffic with minimal drops -  it is just not possible. There are not enough CPUs , not enough RAM....

Sometimes funding is tough, convincing management to buy new/more HW could be difficult for a particular endeavor/test and a number of other reasons...

So what can you do?

BPF


Suricata can utilize BPF (Berkeley Packet Filter) when running inspection. It allows to select and filter the type of traffic you would want Suricata to inspect.


There are three ways you can use BPF filter with Suricata:

  • On the command line
suricata -c /etc/suricata/suricata.yaml -i eth0 -v dst port 80

  • From suricata.yaml
Under each respective runmode in suricata.yaml (afpacket,pfring,pcap) - bpf-filter: port 80 or udp

  • From a file
suricata -c /etc/suricata/suricata.yaml -i eth0 -v -F bpf.file

Inside the bpf.file you would have your BPF filter.


The examples above would filter only the traffic that has dest port 80 and would pass it too Suricata for inspection.

BPF - The tricky part


It DOES make a difference when using BPF if you have VLANs in the mirrored traffic.

Please read here before you continue further - http://taosecurity.blogspot.se/2008/12/bpf-for-ip-or-vlan-traffic.html


The magic


If you want to -
extract all client data , TCP SYN|FIN flags to preserve session state and server response headers
the BPF filter (thanks to Cooper Nelson (UCSD) who shared the filter on our (OISF) mailing list) would look like this:


(port 53 or 443 or 6667) or (tcp dst port 80 or (tcp src port 80 and
(tcp[tcpflags] & (tcp-syn|tcp-fin) != 0 or tcp[((tcp[12:1] & 0xf0) >>
2):4] = 0x48545450)))


That would inspect traffic on ports 53 (DNS) , 443(HTTPS), 6667 (IRC) and 80 (HTTP)

NOTE: the filter above is  for NON VLAN traffic !

Now the same filter for VLAN present traffic would look like this below:

((ip and port 53 or 443 or 6667) or ( ip and tcp dst port 80 or (ip
and tcp src port 80 and (tcp[tcpflags] & (tcp-syn|tcp-fin) != 0 or
tcp[((tcp[12:1] & 0xf0) >> 2):4] = 0x48545450))))
or
((vlan and port 53 or 443 or 6667) or ( vlan and tcp dst port 80 or
(vlan and tcp src port 80 and (tcp[tcpflags] & (tcp-syn|tcp-fin) != 0
or tcp[((tcp[12:1] & 0xf0) >> 2):4] = 0x48545450))))

BPF - my particular case

I did some traffic profiling on the sensor and it could be summed up like this (using iptraf):


you can see that the traffic on port 53 (DNS) is just as much as the one on http. I was facing some tough choices...

The bpf filter that I made for this particular case was:

(
(ip and port 20 or 21 or 22 or 25 or 110 or 161 or 443 or 445 or 587 or 6667)
or ( ip and tcp dst port 80 or (ip and tcp src port 80 and
(tcp[tcpflags] & (tcp-syn|tcp-fin) != 0 or
tcp[((tcp[12:1] & 0xf0) >> 2):4] = 0x48545450))))
or
((vlan and port 20 or 21 or 22 or 25 or 110 or 161 or 443 or 445 or 587 or 6667)
or ( vlan and tcp dst port 80 or (vlan and tcp src port 80 and
(tcp[tcpflags] & (tcp-syn|tcp-fin) != 0 or
tcp[((tcp[12:1] & 0xf0) >> 2):4] = 0x48545450)))
)

That would filter MIXED (both VLAN and NON VLAN) traffic on ports
  • 20/21 (FTP)
  • 25 (SMTP) 
  • 80 (HTTP) 
  • 110 (POP3)
  • 161 (SNMP)
  • 443(HTTPS)
  • 445 (Microsoft-DS Active Directory, Windows shares)
  • 587 (MSA - SNMP)
  • 6667 (IRC) 

and pass it to Suricata for inspection.

I had to drop the DNS - I am not saying this is right to do, but tough times call for tough measures. I had a seriously undersized server (4 cpu 2,5 Ghz 16GB RAM) and traffic between 3-4Gbps

How it is actually done


Suricata
root@snif01:/home/pmanev# suricata --build-info
This is Suricata version 2.0dev (rev 896b614)
Features: PCAP_SET_BUFF LIBPCAP_VERSION_MAJOR=1 PF_RING AF_PACKET HAVE_PACKET_FANOUT LIBCAP_NG LIBNET1.1 HAVE_HTP_URI_NORMALIZE_HOOK HAVE_NSS HAVE_LIBJANSSON
SIMD support: SSE_4_1 SSE_3
Atomic intrisics: 1 2 4 8 16 byte(s)
64-bits, Little-endian architecture
GCC version 4.6.3, C version 199901
compiled with -fstack-protector
compiled with _FORTIFY_SOURCE=2
L1 cache line size (CLS)=64
compiled with LibHTP v0.5.11, linked against LibHTP v0.5.11
Suricata Configuration:
  AF_PACKET support:                       yes
  PF_RING support:                         yes
  NFQueue support:                         no
  NFLOG support:                           no
  IPFW support:                            no
  DAG enabled:                             no
  Napatech enabled:                        no
  Unix socket enabled:                     yes
  Detection enabled:                       yes

  libnss support:                          yes
  libnspr support:                         yes
  libjansson support:                      yes
  Prelude support:                         no
  PCRE jit:                                no
  LUA support:                             no
  libluajit:                               no
  libgeoip:                                yes
  Non-bundled htp:                         no
  Old barnyard2 support:                   no
  CUDA enabled:                            no

  Suricatasc install:                      yes

  Unit tests enabled:                      no
  Debug output enabled:                    no
  Debug validation enabled:                no
  Profiling enabled:                       no
  Profiling locks enabled:                 no
  Coccinelle / spatch:                     no

Generic build parameters:
  Installation prefix (--prefix):          /usr/local
  Configuration directory (--sysconfdir):  /usr/local/etc/suricata/
  Log directory (--localstatedir) :        /usr/local/var/log/suricata/

  Host:                                    x86_64-unknown-linux-gnu
  GCC binary:                              gcc
  GCC Protect enabled:                     no
  GCC march native enabled:                yes
  GCC Profile enabled:                     no

In suricata .yaml

#max-pending-packets: 1024
max-pending-packets: 65534
...
# Runmode the engine should use. Please check --list-runmodes to get the available
# runmodes for each packet acquisition method. Defaults to "autofp" (auto flow pinned
# load balancing).
#runmode: autofp
runmode: workers
.....
.....
af-packet:
  - interface: eth2
    # Number of receive threads (>1 will enable experimental flow pinned
    # runmode)
    threads: 4
    # Default clusterid.  AF_PACKET will load balance packets based on flow.
    # All threads/processes that will participate need to have the same
    # clusterid.
    cluster-id: 98
    # Default AF_PACKET cluster type. AF_PACKET can load balance per flow or per hash.
    # This is only supported for Linux kernel > 3.1
    # possible value are:
    #  * cluster_round_robin: round robin load balancing
    #  * cluster_flow: all packets of a given flow are send to the same socket
    #  * cluster_cpu: all packets treated in kernel by a CPU are send to the same socket
    cluster-type: cluster_cpu
    # In some fragmentation case, the hash can not be computed. If "defrag" is set
    # to yes, the kernel will do the needed defragmentation before sending the packets.
    defrag: yes
    # To use the ring feature of AF_PACKET, set 'use-mmap' to yes
    use-mmap: yes
    # Ring size will be computed with respect to max_pending_packets and number
    # of threads. You can set manually the ring size in number of packets by setting
    # the following value. If you are using flow cluster-type and have really network
    # intensive single-flow you could want to set the ring-size independantly of the number
    # of threads:
    ring-size: 200000
    # On busy system, this could help to set it to yes to recover from a packet drop
    # phase. This will result in some packets (at max a ring flush) being non treated.
    #use-emergency-flush: yes
    # recv buffer size, increase value could improve performance
    # buffer-size: 100000
    # Set to yes to disable promiscuous mode
    # disable-promisc: no
    # Choose checksum verification mode for the interface. At the moment
    # of the capture, some packets may be with an invalid checksum due to
    # offloading to the network card of the checksum computation.
    # Possible values are:
    #  - kernel: use indication sent by kernel for each packet (default)
    #  - yes: checksum validation is forced
    #  - no: checksum validation is disabled
    #  - auto: suricata uses a statistical approach to detect when
    #  checksum off-loading is used.
    # Warning: 'checksum-validation' must be set to yes to have any validation
    #checksum-checks: kernel
    # BPF filter to apply to this interface. The pcap filter syntax apply here.
    #bpf-filter: port 80 or udp
....
....  
detect-engine:
  - profile: high
  - custom-values:
      toclient-src-groups: 2
      toclient-dst-groups: 2
      toclient-sp-groups: 2
      toclient-dp-groups: 3
      toserver-src-groups: 2
      toserver-dst-groups: 4
      toserver-sp-groups: 2
      toserver-dp-groups: 25
  - sgh-mpm-context: auto
 ...
flow-timeouts:

  default:
    new: 5 #30
    established: 30 #300
    closed: 0
    emergency-new: 1 #10
    emergency-established: 2 #100
    emergency-closed: 0
  tcp:
    new: 5 #60
    established: 60 # 3600
    closed: 1 #30
    emergency-new: 1 # 10
    emergency-established: 5 # 300
    emergency-closed: 0 #20
  udp:
    new: 5 #30
    established: 60 # 300
    emergency-new: 5 #10
    emergency-established: 5 # 100
  icmp:
    new: 5 #30
    established: 60 # 300
    emergency-new: 5 #10
    emergency-established: 5 # 100
....
....
stream:
  memcap: 4gb
  checksum-validation: no      # reject wrong csums
  midstream: false
  prealloc-sessions: 50000
  inline: no                  # auto will use inline mode in IPS mode, yes or no set it statically
  reassembly:
    memcap: 8gb
    depth: 12mb                  # reassemble 1mb into a stream
    toserver-chunk-size: 2560
    toclient-chunk-size: 2560
    randomize-chunk-size: yes
    #randomize-chunk-range: 10
...
...
default-rule-path: /etc/suricata/et-config/
rule-files:
 - trojan.rules  
 - malware.rules
 - local.rules
 - activex.rules
 - attack_response.rules
 - botcc.rules
 - chat.rules
 - ciarmy.rules
 - compromised.rules
 - current_events.rules
 - dos.rules
 - dshield.rules
 - exploit.rules
 - ftp.rules
 - games.rules
 - icmp_info.rules
 - icmp.rules
 - imap.rules
 - inappropriate.rules
 - info.rules
 - misc.rules
 - mobile_malware.rules ##
 - netbios.rules
 - p2p.rules
 - policy.rules
 - pop3.rules
 - rbn-malvertisers.rules
 - rbn.rules
 - rpc.rules
 - scada.rules
 - scada_special.rules
 - scan.rules
 - shellcode.rules
 - smtp.rules
 - snmp.rules

...
....
libhtp:

         default-config:
           personality: IDS

           # Can be specified in kb, mb, gb.  Just a number indicates
           # it's in bytes.
           request-body-limit: 12mb
           response-body-limit: 12mb

           # inspection limits
           request-body-minimal-inspect-size: 32kb
           request-body-inspect-window: 4kb
           response-body-minimal-inspect-size: 32kb
           response-body-inspect-window: 4kb

           # decoding
           double-decode-path: no
           double-decode-query: no


Create the BFP file (you can put it anywhere)
touch /home/pmanev/test/bpf-filter


The  bpf-filter should look like this:


root@snif01:/var/log/suricata# cat /home/pmanev/test/bpf-filter
(
(ip and port 20 or 21 or 22 or 25 or 110 or 161 or 443 or 445 or 587 or 6667)
or ( ip and tcp dst port 80 or (ip and tcp src port 80 and
(tcp[tcpflags] & (tcp-syn|tcp-fin) != 0 or
tcp[((tcp[12:1] & 0xf0) >> 2):4] = 0x48545450))))
or
((vlan and port 20 or 21 or 22 or 25 or 110 or 161 or 443 or 445 or 587 or 6667)
or ( vlan and tcp dst port 80 or (vlan and tcp src port 80 and
(tcp[tcpflags] & (tcp-syn|tcp-fin) != 0 or
tcp[((tcp[12:1] & 0xf0) >> 2):4] = 0x48545450)))
)
root@snif01:/var/log/suricata#


Start Suricata like this:
suricata -c /etc/suricata/peter-yaml/suricata-afpacket.yaml --af-packet=eth2 -D -v -F /home/pmanev/test/bpf-filter

Like this I was able to achieve inspection on 3,2-4Gbps with about 20K rules with 1% drops.


In the suricata.log:
root@snif01:/var/log/suricata# more suricata.log
[1274] 21/6/2014 -- 19:36:35 - (suricata.c:1034) <Notice> (SCPrintVersion) -- This is Suricata version 2.0dev (rev 896b614)
[1274] 21/6/2014 -- 19:36:35 - (util-cpu.c:170) <Info> (UtilCpuPrintSummary) -- CPUs/cores online: 4
......
[1275] 21/6/2014 -- 19:36:46 - (detect.c:452) <Info> (SigLoadSignatures) -- 46 rule files processed. 20591 rules successfully loaded, 8 rules failed
[1275] 21/6/2014 -- 19:36:47 - (detect.c:2591) <Info> (SigAddressPrepareStage1) -- 20599 signatures processed. 827 are IP-only rules, 6510 are inspecting packet payload, 15650 inspect ap
plication layer, 0 are decoder event only
.....
.....
[1275] 21/6/2014 -- 19:37:17 - (runmode-af-packet.c:150) <Info> (ParseAFPConfig) -- Going to use command-line provided bpf filter '( (ip and port 20 or 21 or 22 or 25 or 110 or 161 or 44
3 or 445 or 587 or 6667)  or ( ip and tcp dst port 80 or (ip and tcp src port 80 and  (tcp[tcpflags] & (tcp-syn|tcp-fin) != 0 or tcp[((tcp[12:1] & 0xf0) >> 2):4] = 0x48545450)))) or ((vl
an and port 20 or 21 or 22 or 25 or 110 or 161 or 443 or 445 or 587 or 6667)  or ( vlan and tcp dst port 80 or (vlan and tcp src port 80 and  (tcp[tcpflags] & (tcp-syn|tcp-fin) != 0 or
tcp[((tcp[12:1] & 0xf0) >> 2):4] = 0x48545450))) ) '

.....
.....
[1275] 22/6/2014 -- 01:45:34 - (stream.c:182) <Info> (StreamMsgQueuesDeinit) -- TCP segment chunk pool had a peak use of 6674 chunks, more than the prealloc setting of 250
[1275] 22/6/2014 -- 01:45:34 - (host.c:245) <Info> (HostPrintStats) -- host memory usage: 825856 bytes, maximum: 16777216
[1275] 22/6/2014 -- 01:45:35 - (detect.c:3890) <Info> (SigAddressCleanupStage1) -- cleaning up signature grouping structure... complete
[1275] 22/6/2014 -- 01:45:35 - (util-device.c:190) <Notice> (LiveDeviceListClean) -- Stats for 'eth2':  pkts: 2820563520, drop: 244696588 (8.68%), invalid chksum: 0

That gave me about 9% drops...... I further adjusted the filter (after realizing I could drop 445 Windows Shares for the moment from inspection).

The new filter was like so:

root@snif01:/var/log/suricata# cat /home/pmanev/test/bpf-filter
(
(ip and port 20 or 21 or 22 or 25 or 110 or 161 or 443 or 587 or 6667)
or ( ip and tcp dst port 80 or (ip and tcp src port 80 and
(tcp[tcpflags] & (tcp-syn|tcp-fin) != 0 or
tcp[((tcp[12:1] & 0xf0) >> 2):4] = 0x48545450))))
or
((vlan and port 20 or 21 or 22 or 25 or 110 or 161 or 443 or 587 or 6667)
or ( vlan and tcp dst port 80 or (vlan and tcp src port 80 and
(tcp[tcpflags] & (tcp-syn|tcp-fin) != 0 or
tcp[((tcp[12:1] & 0xf0) >> 2):4] = 0x48545450)))
)
root@snif01:/var/log/suricata#
Notice - I removed port 445.

So with that filter I was able to do 0.95% drops with 20K rules:

[16494] 22/6/2014 -- 10:13:10 - (suricata.c:1034) <Notice> (SCPrintVersion) -- This is Suricata version 2.0dev (rev 896b614)
[16494] 22/6/2014 -- 10:13:10 - (util-cpu.c:170) <Info> (UtilCpuPrintSummary) -- CPUs/cores online: 4
...
...
[16495] 22/6/2014 -- 10:13:20 - (detect.c:452) <Info> (SigLoadSignatures) -- 46 rule files processed. 20591 rules successfully loaded, 8 rules failed
[16495] 22/6/2014 -- 10:13:21 - (detect.c:2591) <Info> (SigAddressPrepareStage1) -- 20599 signatures processed. 827 are IP-only rules, 6510 are inspecting packet payload, 15650 inspect application layer, 0 are decoder event only
...
...
[16495] 23/6/2014 -- 01:45:32 - (host.c:245) <Info> (HostPrintStats) -- host memory usage: 1035520 bytes, maximum: 16777216
[16495] 23/6/2014 -- 01:45:32 - (detect.c:3890) <Info> (SigAddressCleanupStage1) -- cleaning up signature grouping structure... complete
[16495] 23/6/2014 -- 01:45:32 - (util-device.c:190) <Notice> (LiveDeviceListClean) -- Stats for 'eth2':  pkts: 6550734692, drop: 62158315 (0.95%), invalid chksum: 0


 So with that BPF filter we have ->

Pros 


I was able to inspect with a lot of rules(20K) a lot of traffic (4Gbps peak) with an undersized and minimal HW (4 CPU 16GB RAM ) sustained with less then 1% drops

Cons

  • Not inspecting DNS
  • Making an assumption that all HTTP traffic is using port 80. (Though in my case 99.9% of the http traffic was on port 80)
  • This is an advanced BPF filter , requires a good chunk of knowledge in order to understand/implement/re-edit


 Simple and efficient


In the case where you have a network or a device that generates a lot of false positives and you are sure you can disregard any traffic from that device  - you could do a filter like this:

(ip and not host 1.1.1.1 ) or (vlan and not host 1.1.1.1)

for a VLAN and non VLAN traffic mixed. If you are sure there is no VLAN traffic you could just do that:
ip and not host 1.1.1.1

Then  you can simply start Suricata like so:
suricata -c /etc/suricata/peter-yaml/suricata-afpacket.yaml --af-packet=eth2 -D -v \(ip and not host 1.1.1.1 \) or \(vlan and not host 1.1.1.1\)

or like this respectively (to the two examples above):
suricata -c /etc/suricata/peter-yaml/suricata-afpacket.yaml --af-packet=eth2 -D -v ip and not host 1.1.1.1


Tuesday, June 17, 2014

HTTP Header fields extended logging with Suricata IDPS


With the release of Suricata 2.0.1 there is availability and option to do extended custom HTTP header fields logging through the JSON output module.

For the Elasticsearch/Logstash/Kibana users there is a ready to use template that you could download from here -
https://github.com/pevma/Suricata-Logstash-Templates

So what does this mean?

Well besides the standard http logging in the eve.json you also get 47 additional HTTP fields logged, mainly these:
accept
accept-charset
accept-encoding
accept-language
accept-datetime
authorization
cache-control
cookie
from
max-forwards
origin
pragma
proxy-authorization
range
te
via
x-requested-with
dnt
x-forwarded-proto
accept-range
age
allow
connection
content-encoding
content-language
content-length
content-location
content-md5
content-range
content-type
date
etags
last-modified
link
location
proxy-authenticate
referrer
refresh
retry-after
server
set-cookie
trailer
transfer-encoding
upgrade
vary
warning
www-authenticate

What they are and what they mean/affect you could read more about here:
http://en.wikipedia.org/wiki/List_of_HTTP_header_fields

You can choose any combination of those fields above or all of them. What you need to do is simply add those to the existing logging in suricata.yaml's eve section. To add all of them if found in the HTTP traffic you could do like so:
  - eve-log:
      enabled: yes
      type: file #file|syslog|unix_dgram|unix_stream
      filename: eve.json
      # the following are valid when type: syslog above
      #identity: "suricata"
      #facility: local5
      #level: Info ## possible levels: Emergency, Alert, Critical,
                   ## Error, Warning, Notice, Info, Debug
      types:
        - alert
        - http:
            extended: yes     # enable this for extended logging information
            # custom allows additional http fields to be included in eve-log
            # the example below adds three additional fields when uncommented
            #custom: [Accept-Encoding, Accept-Language, Authorization]
            custom: [accept, accept-charset, accept-encoding, accept-language,
            accept-datetime, authorization, cache-control, cookie, from,
            max-forwards, origin, pragma, proxy-authorization, range, te, via,
            x-requested-with, dnt, x-forwarded-proto, accept-range, age,
            allow, connection, content-encoding, content-language,
            content-length, content-location, content-md5, content-range,
            content-type, date, etags, last-modified, link, location,
            proxy-authenticate, referrer, refresh, retry-after, server,
            set-cookie, trailer, transfer-encoding, upgrade, vary, warning,
            www-authenticate]
        - dns
        - tls:
            extended: yes     # enable this for extended logging information
        - files:
            force-magic: yes   # force logging magic on all logged files
            force-md5: yes     # force logging of md5 checksums
        #- drop
        - ssh
Then you just start Suricata.

What is the benefit?

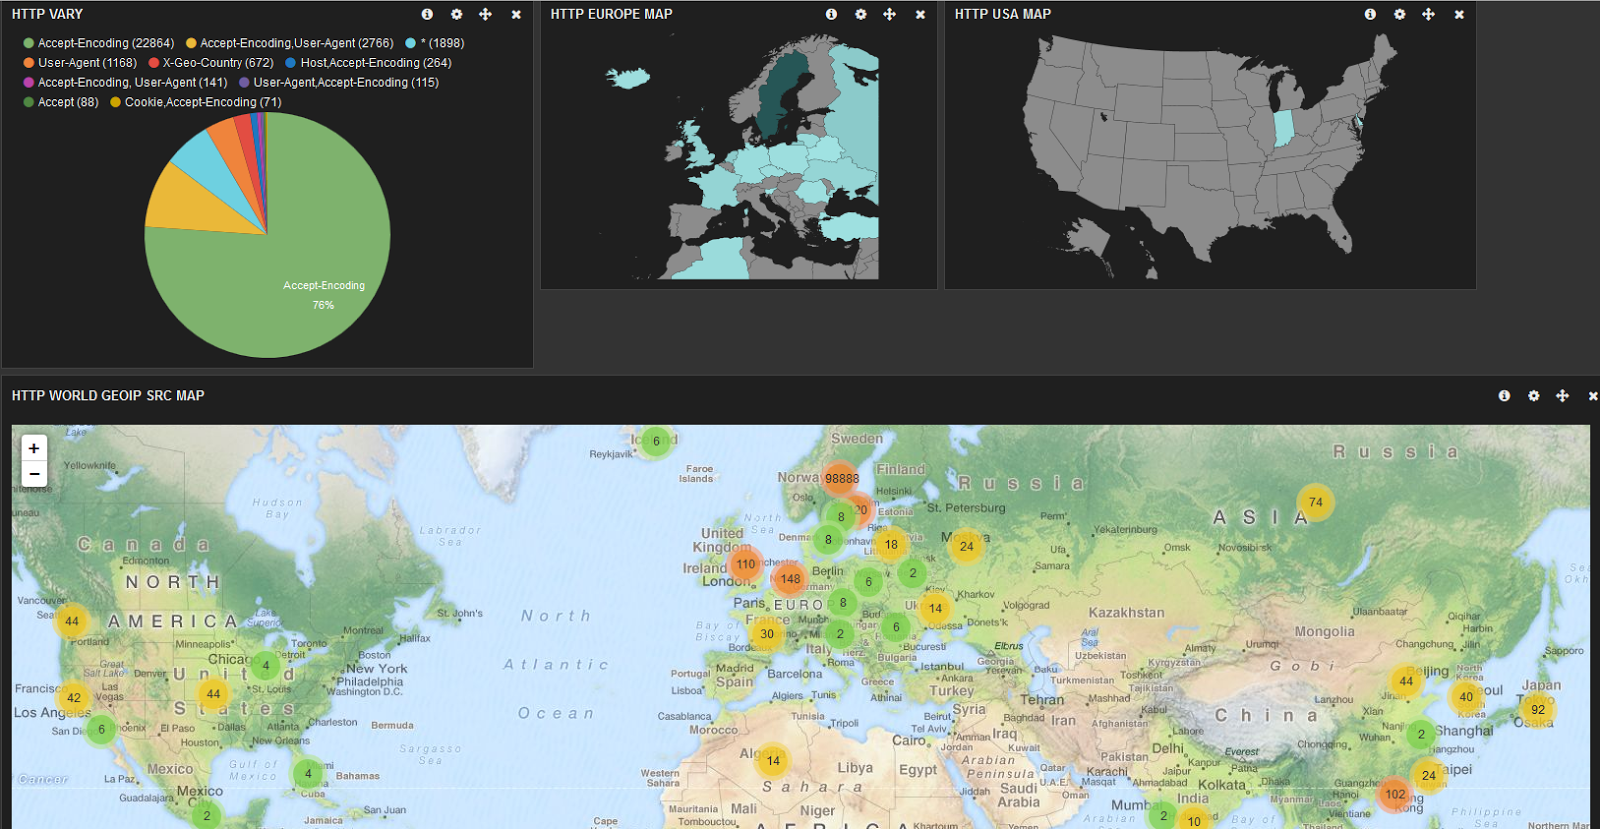
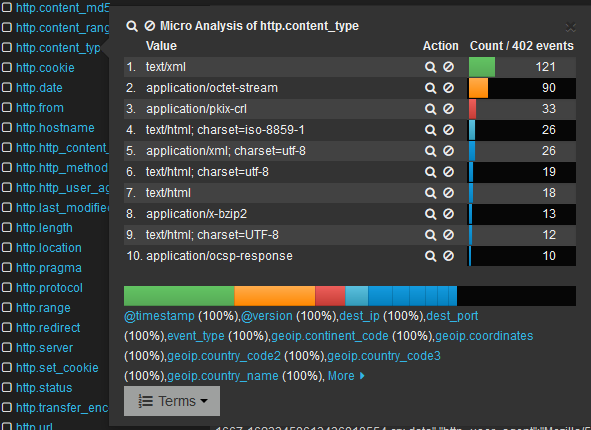
You can log and search/filter/select through any or all of those 60 or so http header fields. JSON is a standard format - so depending on what you are using for DB and/or search engine, you could get very easy interesting and very helpful statistics that would help your security teams.

Some possible stats using Elasticsearch and Kibana
(how to set up Elasticsearch, Logstash and Kibana with Suricata)-


Saturday, June 14, 2014

Suricata IDS/IPS - TCP segment pool size preallocation


In the default suricata.yaml stream section we have:
stream:
  memcap: 32mb
  checksum-validation: no      # reject wrong csums
  async-oneside: true
  midstream: true
  inline: no                  # auto will use inline mode in IPS mode, yes or no set it statically
  reassembly:
    memcap: 64mb
    depth: 1mb                  # reassemble 1mb into a stream
    toserver-chunk-size: 2560
    toclient-chunk-size: 2560
    randomize-chunk-size: yes
    #randomize-chunk-range: 10
    #raw: yes
    #chunk-prealloc: 250
    #segments:
    #  - size: 4
    #    prealloc: 256
    #  - size: 16
    #    prealloc: 512
    #  - size: 112
    #    prealloc: 512
    #  - size: 248
    #    prealloc: 512
    #  - size: 512
    #    prealloc: 512
    #  - size: 768
    #    prealloc: 1024
    #  - size: 1448
    #    prealloc: 1024
    #  - size: 65535
    #    prealloc: 128


So what are these segment preallocations for?
Let's have a look. When Suricata exits (or kill -15 PidOfSuricata) it produces a lot of useful statistics in the suricata.log file (you can enable that from the suricata.yaml and use the "-v" switch (verbose) when starting Suricata):
The example below is for exit stats.
   
tail -20 StatsByDate/suricata-2014-06-01.log
[24344] 1/6/2014 -- 01:45:52 - (source-af-packet.c:1810) <Info> (ReceiveAFPThreadExitStats) -- (AFPacketeth314) Packets 7317661624, bytes 6132661347126
[24344] 1/6/2014 -- 01:45:52 - (stream-tcp.c:4643) <Info> (StreamTcpExitPrintStats) -- Stream TCP processed 3382528539 TCP packets
[24345] 1/6/2014 -- 01:45:52 - (source-af-packet.c:1807) <Info> (ReceiveAFPThreadExitStats) -- (AFPacketeth315) Kernel: Packets 8049357450, dropped 352658715
[24345] 1/6/2014 -- 01:45:52 - (source-af-packet.c:1810) <Info> (ReceiveAFPThreadExitStats) -- (AFPacketeth315) Packets 7696486934, bytes 6666577738944
[24345] 1/6/2014 -- 01:45:52 - (stream-tcp.c:4643) <Info> (StreamTcpExitPrintStats) -- Stream TCP processed 3357321803 TCP packets
[24346] 1/6/2014 -- 01:45:52 - (source-af-packet.c:1807) <Info> (ReceiveAFPThreadExitStats) -- (AFPacketeth316) Kernel: Packets 7573051188, dropped 292897219
[24346] 1/6/2014 -- 01:45:52 - (source-af-packet.c:1810) <Info> (ReceiveAFPThreadExitStats) -- (AFPacketeth316) Packets 7279948375, bytes 6046562324948
[24346] 1/6/2014 -- 01:45:52 - (stream-tcp.c:4643) <Info> (StreamTcpExitPrintStats) -- Stream TCP processed 3454330660 TCP packets
[24329] 1/6/2014 -- 01:45:53 - (stream-tcp-reassemble.c:502) <Info> (StreamTcpReassembleFree) -- TCP segment pool of size 4 had a peak use of 60778 segments, more than the prealloc setting of 256
[24329] 1/6/2014 -- 01:45:53 - (stream-tcp-reassemble.c:502) <Info> (StreamTcpReassembleFree) -- TCP segment pool of size 16 had a peak use of 314953 segments, more than the prealloc setting of 512
[24329] 1/6/2014 -- 01:45:53 - (stream-tcp-reassemble.c:502) <Info> (StreamTcpReassembleFree) -- TCP segment pool of size 112 had a peak use of 113739 segments, more than the prealloc setting of 512
[24329] 1/6/2014 -- 01:45:53 - (stream-tcp-reassemble.c:502) <Info> (StreamTcpReassembleFree) -- TCP segment pool of size 248 had a peak use of 17893 segments, more than the prealloc setting of 512
[24329] 1/6/2014 -- 01:45:53 - (stream-tcp-reassemble.c:502) <Info> (StreamTcpReassembleFree) -- TCP segment pool of size 512 had a peak use of 31787 segments, more than the prealloc setting of 512
[24329] 1/6/2014 -- 01:45:53 - (stream-tcp-reassemble.c:502) <Info> (StreamTcpReassembleFree) -- TCP segment pool of size 768 had a peak use of 30769 segments, more than the prealloc setting of 1024
[24329] 1/6/2014 -- 01:45:53 - (stream-tcp-reassemble.c:502) <Info> (StreamTcpReassembleFree) -- TCP segment pool of size 1448 had a peak use of 89446 segments, more than the prealloc setting of 1024
[24329] 1/6/2014 -- 01:45:53 - (stream-tcp-reassemble.c:502) <Info> (StreamTcpReassembleFree) -- TCP segment pool of size 65535 had a peak use of 81214 segments, more than the prealloc setting of 128
[24329] 1/6/2014 -- 01:45:53 - (stream.c:182) <Info> (StreamMsgQueuesDeinit) -- TCP segment chunk pool had a peak use of 20306 chunks, more than the prealloc setting of 250
[24329] 1/6/2014 -- 01:45:53 - (host.c:245) <Info> (HostPrintStats) -- host memory usage: 390144 bytes, maximum: 16777216
[24329] 1/6/2014 -- 01:45:55 - (detect.c:3890) <Info> (SigAddressCleanupStage1) -- cleaning up signature grouping structure... complete
[24329] 1/6/2014 -- 01:45:55 - (util-device.c:185) <Notice> (LiveDeviceListClean) -- Stats for 'eth3':  pkts: 124068935209, drop: 5245430626 (4.23%), invalid chksum: 0


Notice all the "TCP segment pool" messages. This is the actual tcp segment pool reassembly stats for that period of time that Suricata was running. We could adjust accordingly in the suricata.yaml (as compared to the default settings above)
   
stream:
  memcap: 14gb
  checksum-validation: no      # reject wrong csums
  midstream: false
  prealloc-sessions: 375000
  inline: no                  # auto will use inline mode in IPS mode, yes or no set it statically
  reassembly:
    memcap: 20gb
    depth: 12mb                  # reassemble 1mb into a stream
    toserver-chunk-size: 2560
    toclient-chunk-size: 2560
    randomize-chunk-size: yes
    #randomize-chunk-range: 10
    raw: yes
    chunk-prealloc: 20556
    segments:
      - size: 4
        prealloc: 61034
      - size: 16
        prealloc: 315465
      - size: 112
        prealloc: 114251
      - size: 248
        prealloc: 18405
      - size: 512
        prealloc: 30769
      - size: 768
        prealloc: 31793
      - size: 1448
        prealloc: 90470
      - size: 65535
        prealloc: 81342


The total RAM (reserved) consumption for these preallocations (from the stream.reassembly.memcap value ) would be:

4*61034 + 16*315465 + 112*114251 + 248*18405 + 512*30769 + 768*31793 + 1448*90470 + 65535*81342 
= 5524571410 bytes
= 5.14 GB of RAM

So we could preallocate the tcp segments and take the Suricata tuning even a step further and improve performance as well.

So now when you start Suricata with the "-v" switch in your suricata.log with this specific set up described above you should see something like:
...
...
[30709] 1/6/2014 -- 12:17:34 - (stream-tcp-reassemble.c:425) <Info> (StreamTcpReassemblyConfig) -- segment pool: pktsize 4, prealloc 61034
[30709] 1/6/2014 -- 12:17:34 - (stream-tcp-reassemble.c:425) <Info> (StreamTcpReassemblyConfig) -- segment pool: pktsize 16, prealloc 315465
[30709] 1/6/2014 -- 12:17:34 - (stream-tcp-reassemble.c:425) <Info> (StreamTcpReassemblyConfig) -- segment pool: pktsize 112, prealloc 114251
[30709] 1/6/2014 -- 12:17:34 - (stream-tcp-reassemble.c:425) <Info> (StreamTcpReassemblyConfig) -- segment pool: pktsize 248, prealloc 18405
[30709] 1/6/2014 -- 12:17:34 - (stream-tcp-reassemble.c:425) <Info> (StreamTcpReassemblyConfig) -- segment pool: pktsize 512, prealloc 30769
[30709] 1/6/2014 -- 12:17:34 - (stream-tcp-reassemble.c:425) <Info> (StreamTcpReassemblyConfig) -- segment pool: pktsize 768, prealloc 31793
[30709] 1/6/2014 -- 12:17:35 - (stream-tcp-reassemble.c:425) <Info> (StreamTcpReassemblyConfig) -- segment pool: pktsize 1448, prealloc 90470
[30709] 1/6/2014 -- 12:17:35 - (stream-tcp-reassemble.c:425) <Info> (StreamTcpReassemblyConfig) -- segment pool: pktsize 65535, prealloc 81342
[30709] 1/6/2014 -- 12:17:35 - (stream-tcp-reassemble.c:461) <Info> (StreamTcpReassemblyConfig) -- stream.reassembly "chunk-prealloc": 20556
...
...

NOTE:
Those 5.14 GB RAM in the example here will be preallocated (taken) from the stream.reassembly.memcap value. In other words it will not consume 5.14 GB of RAM more.

So be careful when setting up preallocation in order not to preallocate more of what you have.
In my case of 10Gbps suricata.yaml config I had:

stream:
  memcap: 14gb
  checksum-validation: no      # reject wrong csums
  midstream: false
  prealloc-sessions: 375000
  inline: no                  # auto will use inline mode in IPS mode, yes or no set it statically
  reassembly:
    memcap: 20gb
    depth: 12mb                  # reassemble 1mb into a stream


What this helps with is that it lowers CPU usage/contention for TCP segment allocation during reassembly - it is already preallocated and Suricata just uses it instead of creating it everytime it needs it. It also helps minimize the initial drops during startup.

Highly adaptable and  flexible.